


 |
|
Platinum price prefers the bearish trend– Forecast today – 27-5-2026
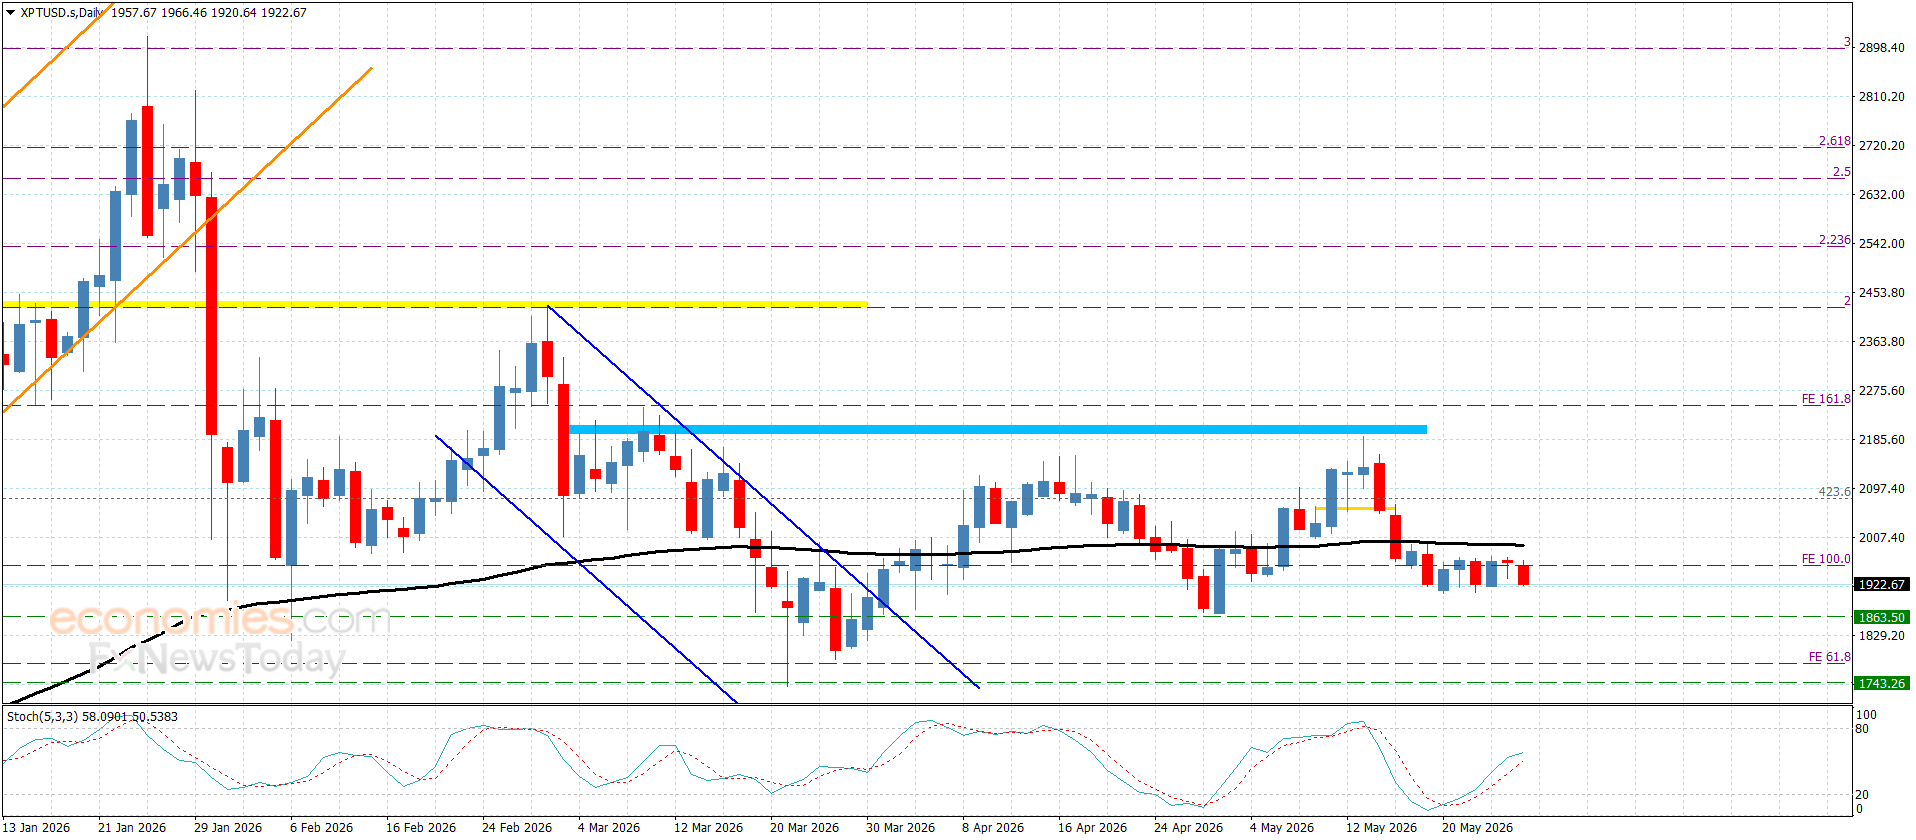
Despite the weakness of Platinum price’s last trading, its attempt to settle below the moving average 55 at $2000.00 level supports the attempt of activating the bearish corrective trend, to settle near $1922.00.
The continuation of the negative pressures will reinforce the chances of reaching the corrective target at $1865.00, where breaking it might extend the trading towards $1775.00, which will form the next station for the negative attempts, while the risk of changing the trend and begin the bullish trend remains valid if the price managed to surpass $2080.00.
The expected trading range for today is between $1865.00 and $1990.00
Trend forecast: Bearish
Copper price remains unchanged – Forecast today – 27-5-2026
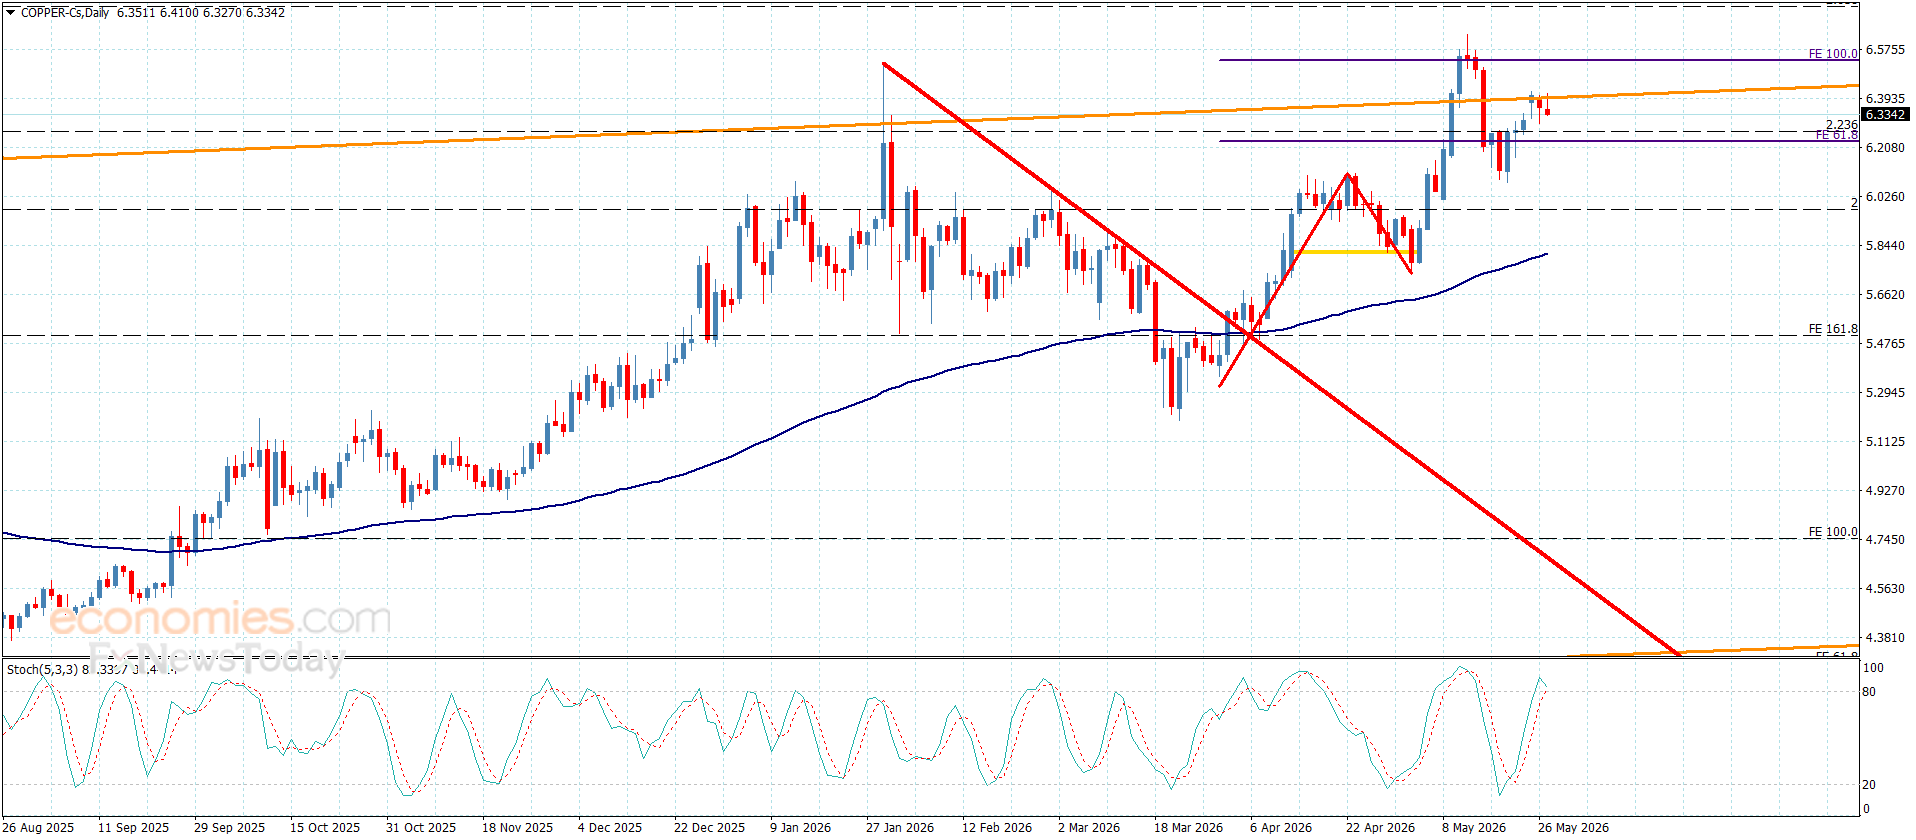
Copper prices remained stable in recent trading, settled near $6.3500 level affected by its confinement between $6.4000 barrier, while $6.1000 level form extra support against the attempt of activating the bearish corrective trend.
Note that providing negative momentum signals by stochastic may push the price toward forming some bearish waves and attempting to attack the current support level. A break below this support would confirm readiness for further corrective waves, to target $5.9500 and $5.8000, while breaching the barrier and holding above it will turn it to the bullish path, to expect recording extra gains by its rally towards $6.6000.
The expected trading range for today is between $6.1000 and $6.4000
Trend forecast: Fluctuated within the bullish trend
Ethereum (ETHUSD) Remains Under Bearish Pressure – Analysis – 27-05-2026
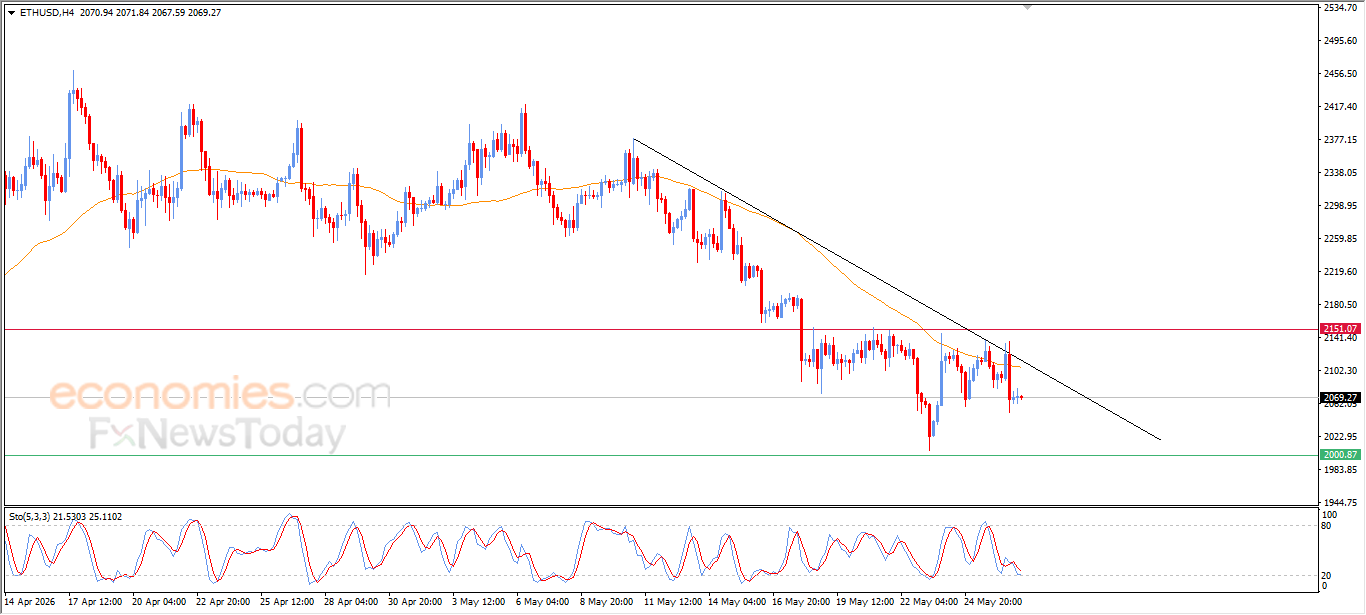
Ethereum (ETHUSD) continues to hold near sharp recent losses during intraday trading, amid the dominance of the main bearish trend on short-term basis, with its trading alongside supportive trend line for this path, besides its trading below EMA50,which adds further downside pressure, especially with ongoing negative signals from the relative strength indicators despite remaining in deeply oversold territory.
Brent Crude Oil is Under Negative Pressure – Analysis – 27-05-2026
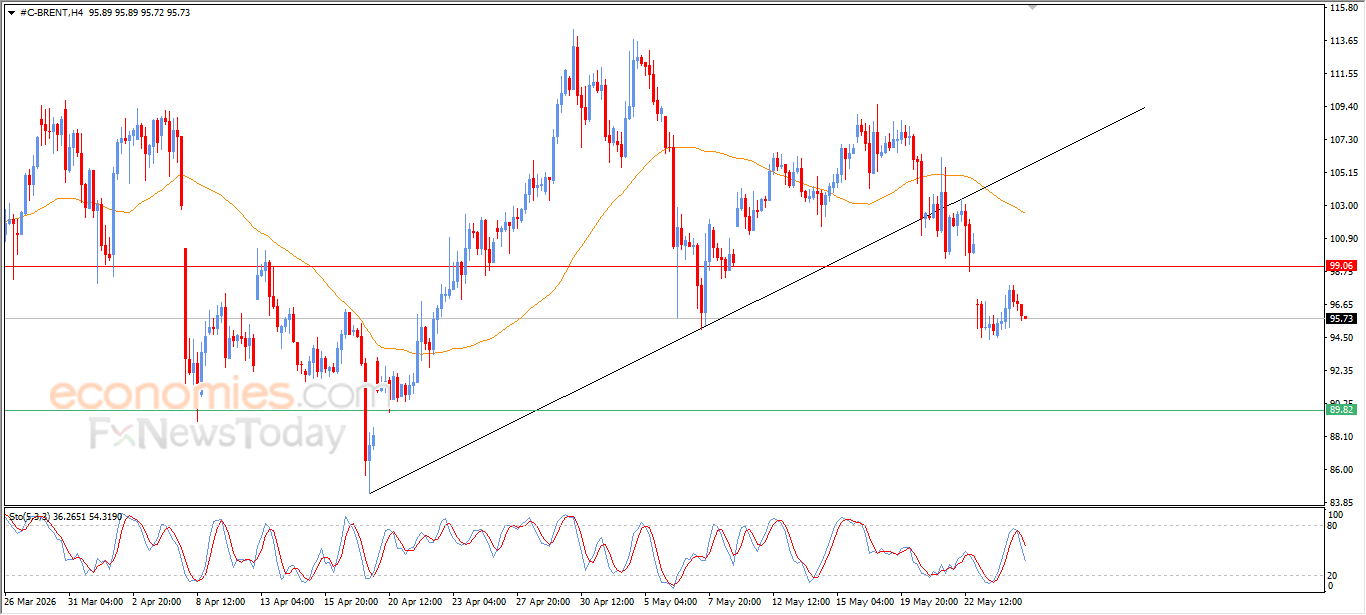
Brent crude oil price declined during its latest intraday sessions, amid the dominance of steep bearish corrective wave on the short-term basis, with the continuation of the negative pressure that comes from its trading below EMA50, which represents a dynamic resistance that reduces the chances of the sustainable recovery on the near-term basis, especially after forming negative divergence on the relative strength indicators, after reaching overbought levels, exaggeratedly compared to the price move, with the emergence of the negative signals.