Platinum price is waiting to surpass the barrier – Forecast today – 11-12-2025
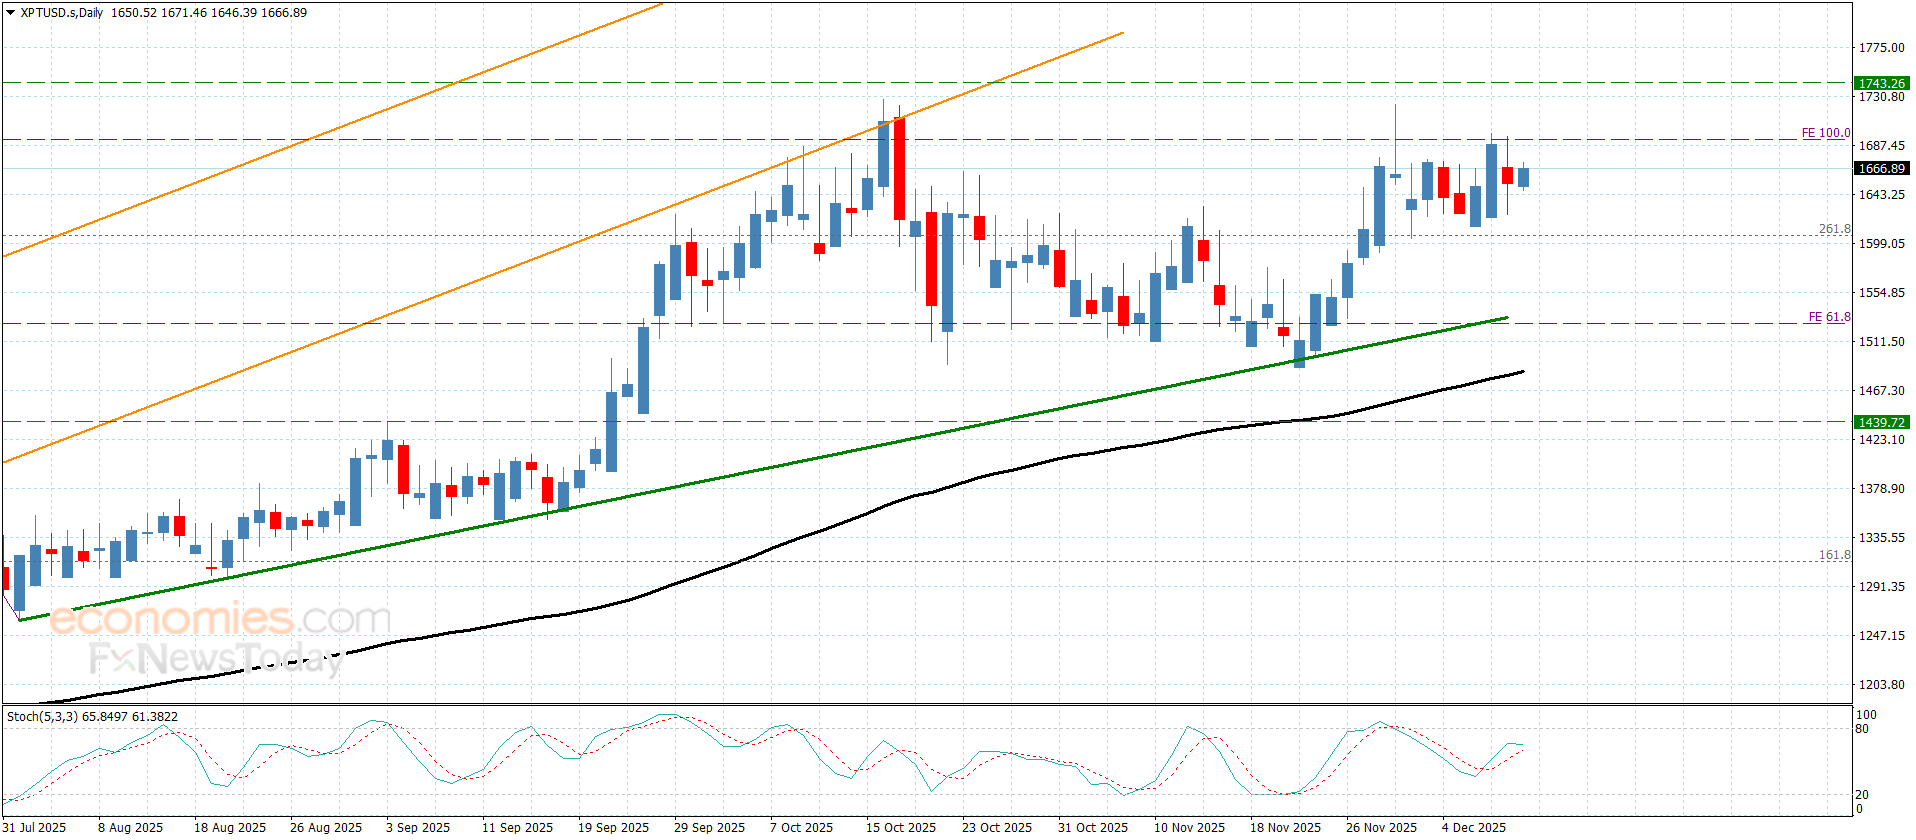
Platinum price surrendered to the sideways bias dominance, to fluctuate slowly near$1660.00 level, affected by the stability at $1695.00 barrier, which obstructs the chances of resuming the main bullish attack.
The price might keep providing sideways trading, however the stability above the extra support of $1605.00 supports the chances of renewing the bullish attempts, therefore, we will keep waiting for breaching the current barrier, to open the way for recording new gains that might begin at $1715.00 and $1745.00.
The expected trading range for today is between $1635.00 and $1695.00
Trend forecast: Sideways until achieving the breach
Copper price repeats the sideways fluctuation– Forecast today – 11-12-2025
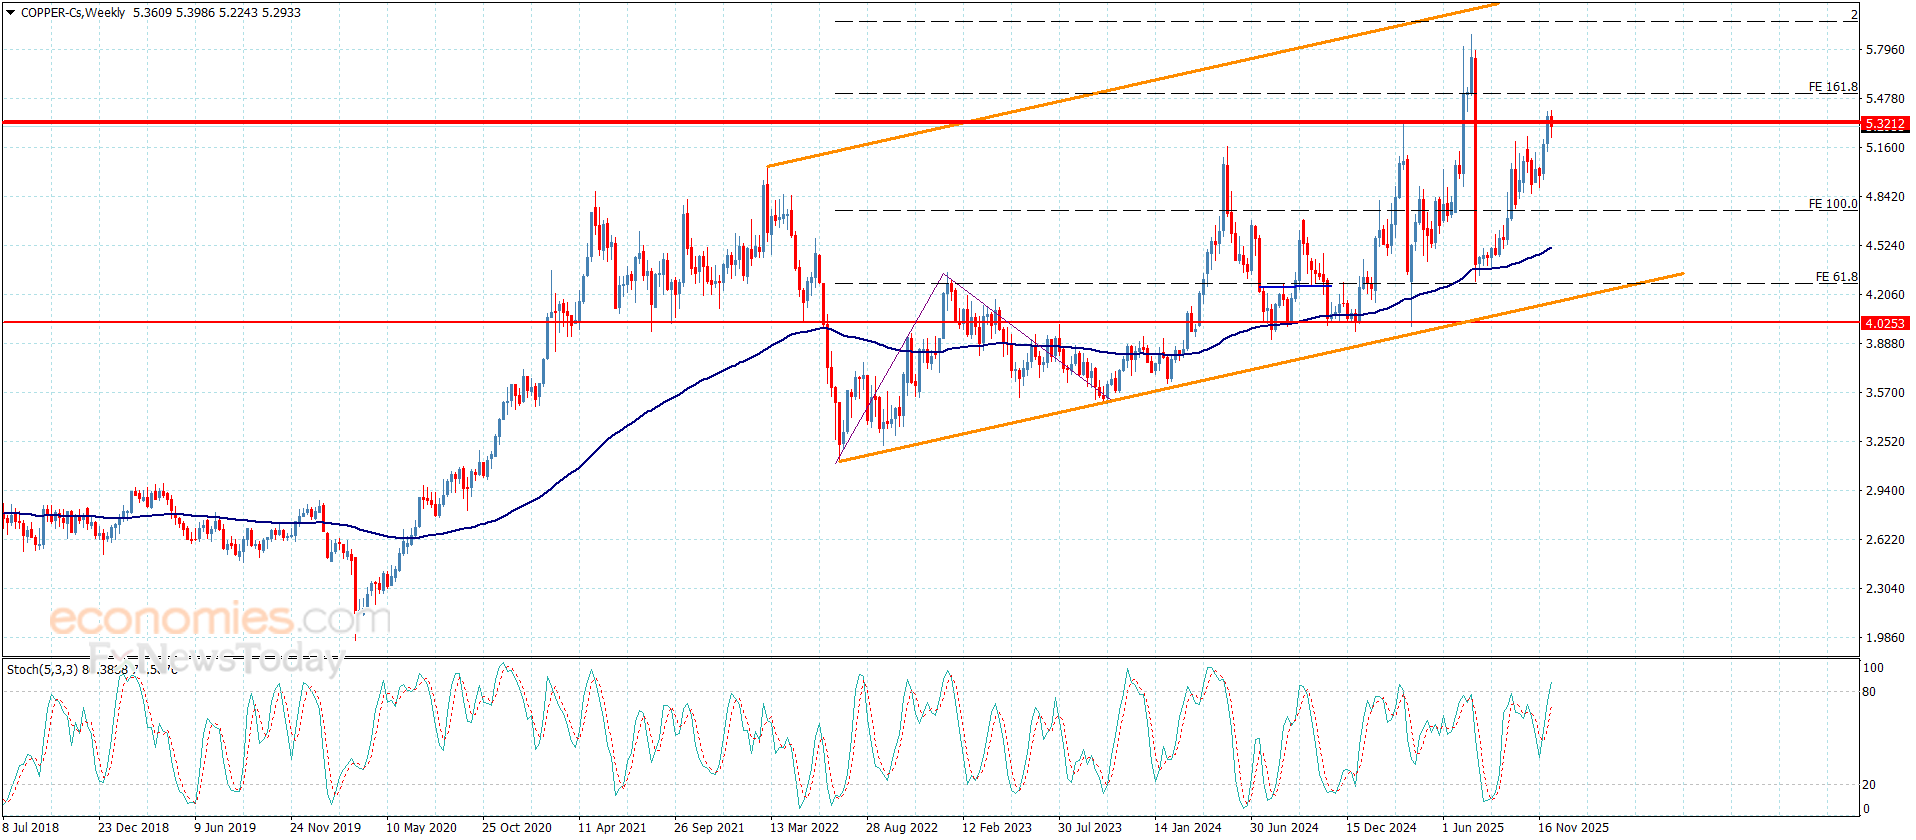
Copper price continued providing sideways trading, despite the positive factors to keep its fluctuating moves near the barrier at $5.3200, we will keep waiting to renew the bullish attempts by surpassing the current barrier to begin recording new gains by its rally towards $5.5000 reaching $5.6500 in the medium period trading.
Noting that the price decline below the extra support at $5.1300 will delay the bullish attack, which forces it to activate the corrective trading by suffering some losses by reaching $4.9500 and $4.7500.
The expected trading range for today is between 3.7500 and 4.0500
Trend forecast: Bullish
The (ETHUSD) is looking for bullish momentum- Analysis- 11-12-2025
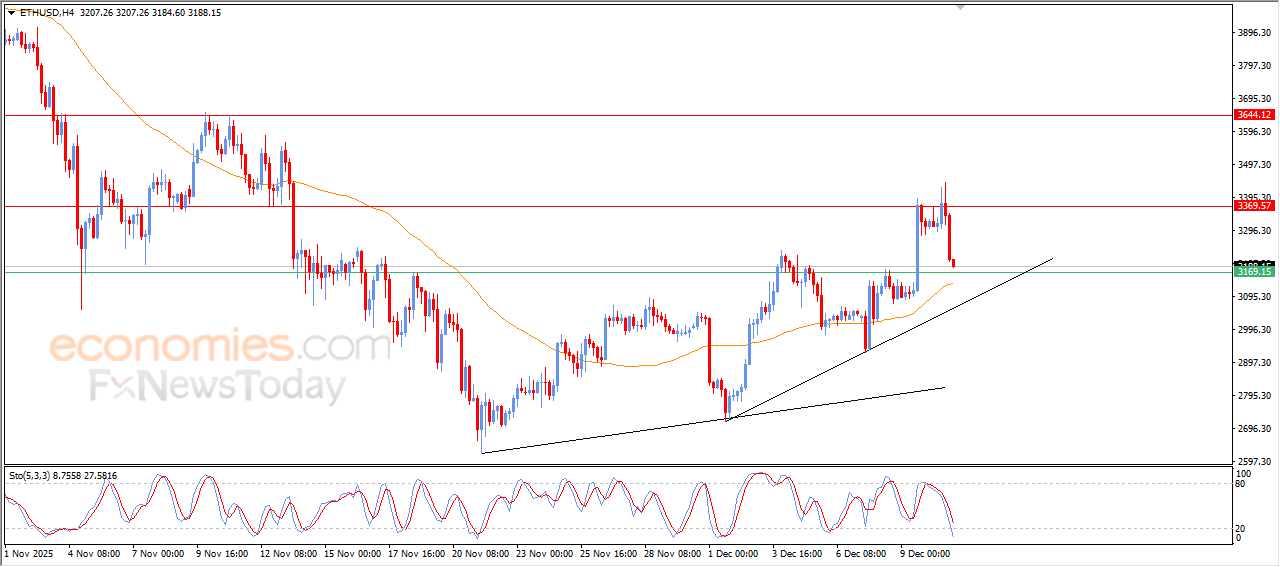
The (ETHUSD) price suffered sharp losses in its last intraday trading, due to the stability of the key resistance at $3,370, accompanied by forming negative divergence on the relative strength indicators, to slip lower after a journey to look for the required bullish momentum for its recovery, amid the continuation of the positive support due to its trading above EMA50, under the dominance of the bullish corrective trend on the short-term basis and its trading alongside main and minor trend lines that support this track.
Brent crude oil is showing new negative signals- Analysis-11-12-2025
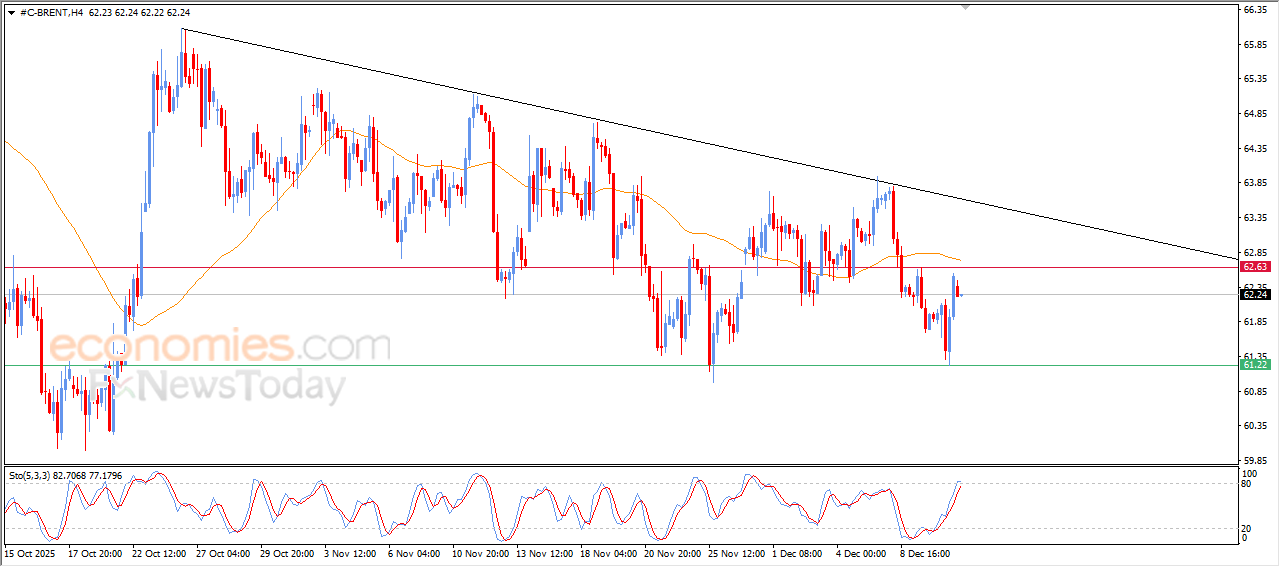
The (Brent) price declined in its last intraday trading, after offloading big part of its previous losses, amid the continuation of the negative pressure due to its trading below EMA50, and under the dominance of the bearish trend on the short-term basis and its trading alongside trend line, accompanied by the emergence of negative overlapping signals on the relative strength indicators, after reaching overbought levels exaggeratedly compared to the price move, to indicate forming negative divergence.