Platinum price hovers near the moving average– Forecast today – 25-3-2026
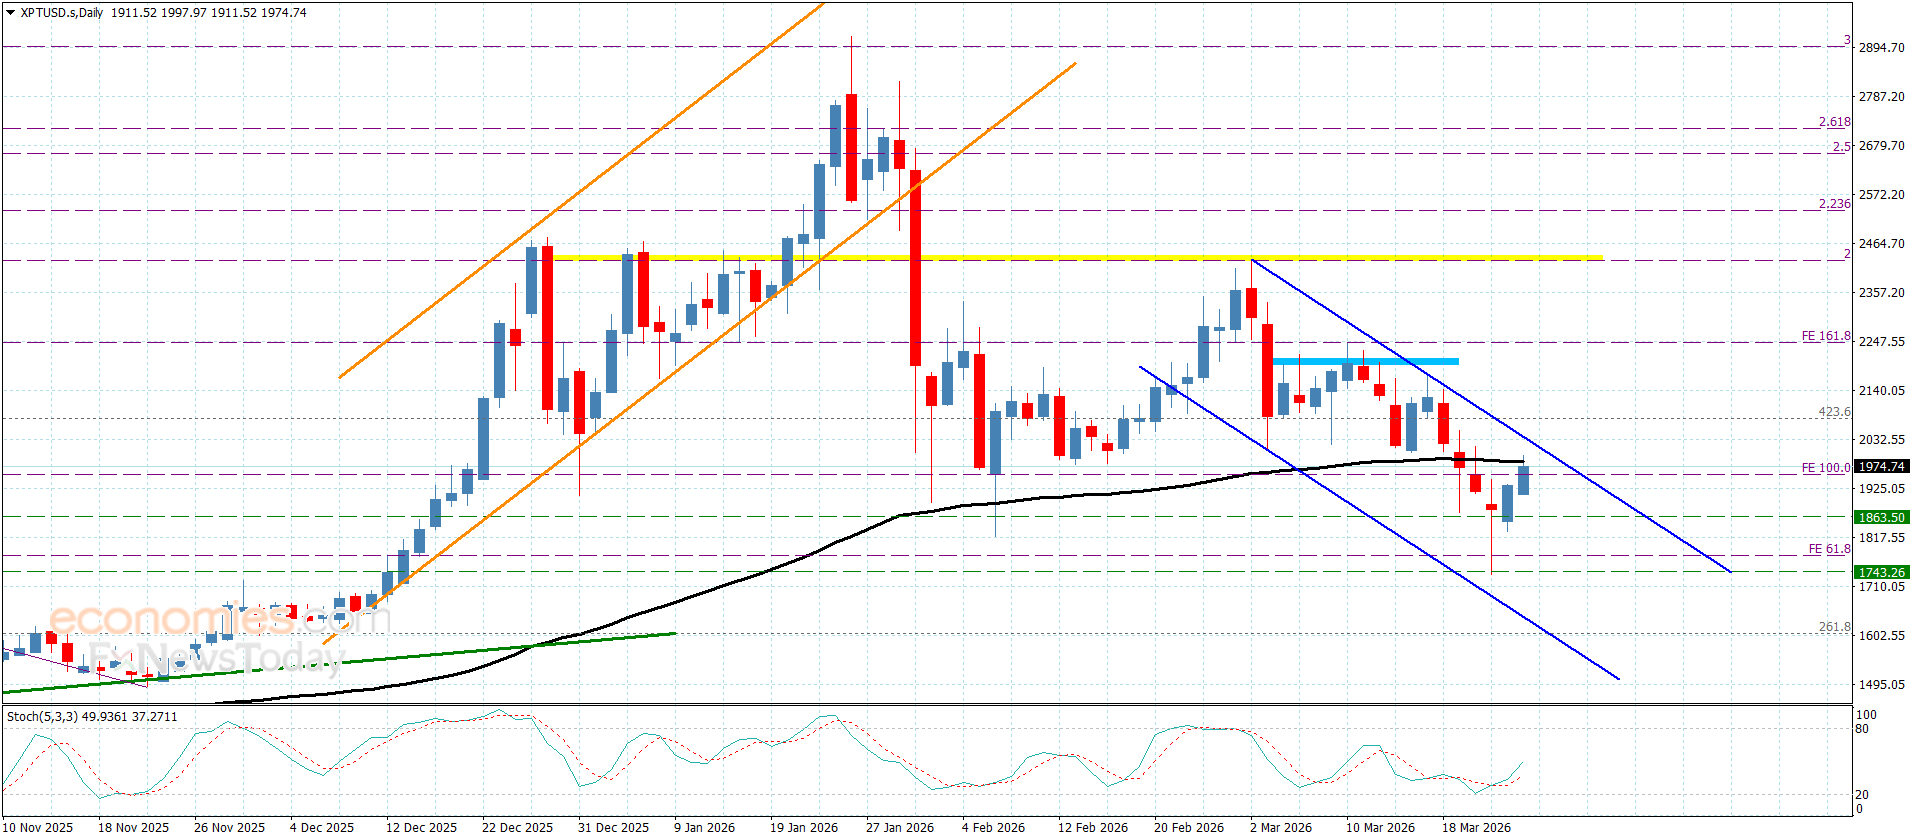
The effect of Fibonacci positivity by forming bullish waves to rally towards the moving average 55 near $1985.00, keeping its stability within the bearish channel’s levels, which represents an extension level for the main resistance at 2040.00 level.
The stability below the main resistance makes us keep the bearish scenario, as gathering the negative momentum makes us begin targeting some negative stations by reaching $1865.00 and $1775.00, while breaching the resistance and holding above it will confirm regaining the bullish trend, to attempt to reach $2090.00 initially.
The expected trading range for today is between $1865.00 and $2000.00
Trend forecast: Bearish
Copper price repeats the fluctuation near the barrier– Forecast today – 25-3-2026
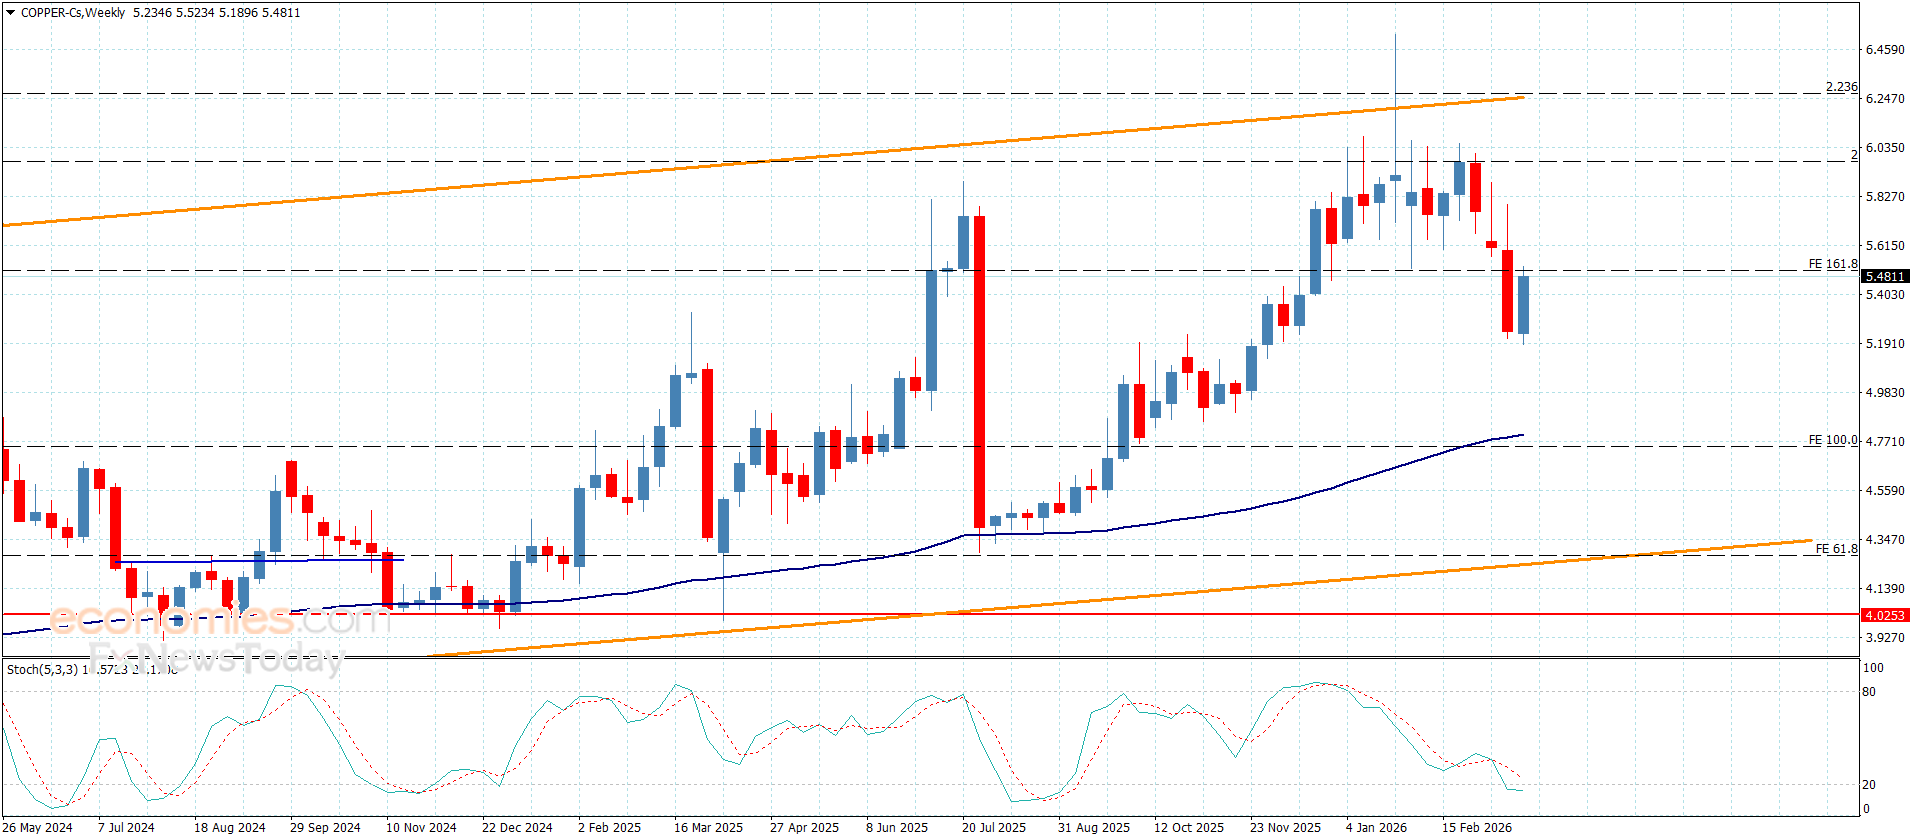
Copper price neediness to the negative momentum that comes from the moving average 55 positivity contradiction with stochastic attempt to provide the negative momentum led to form new sideways trading, due to its fluctuation near the barrier at $5.5100 level.
This barrier represents a detecting key for the near and medium trading, so the stability below it confirms the dominance of the bearish corrective trend, which might target $5.2700 and $4.9500, while surpassing the barrier and holding above it will force the price to delay the decline and begin providing bullish trading, attempting to reach $5.6300 and $5.7600.
The expected trading range for today is between $5.2700 and $5.5100
Trend forecast: Bearish
Ethereum price (ETHUSD) caught between hammer and anvil - Analysis- 25-03-2026
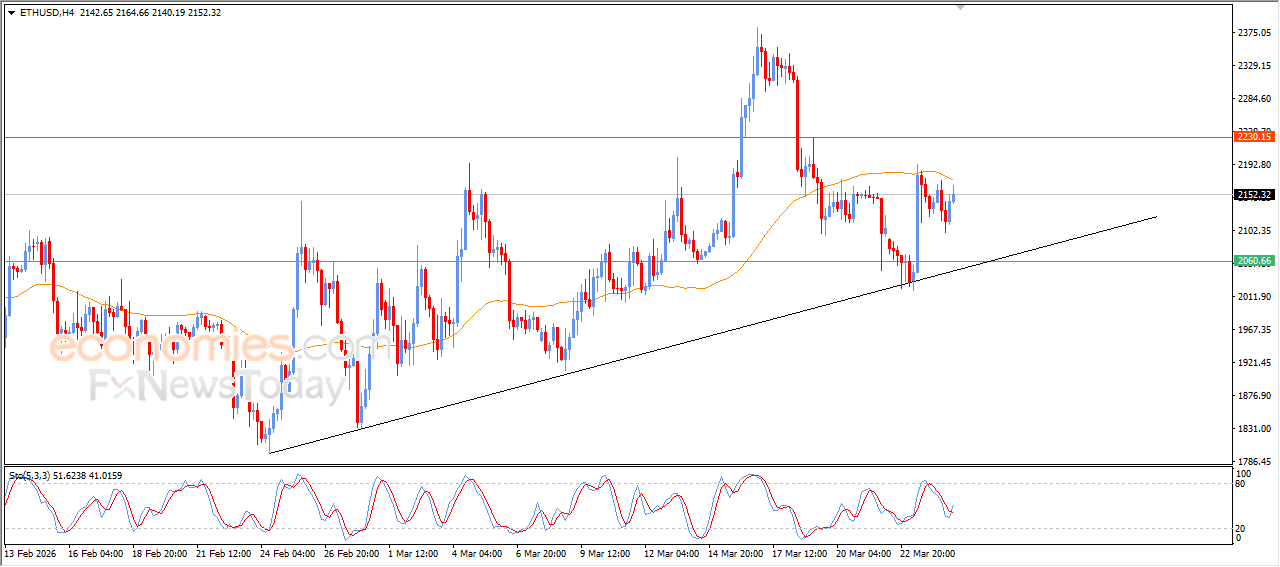
Ethereum price (ETHUSD) rose during its recent intraday trading, with the dominance of the main short-term bullish trend, moving alongside a trendline that supports the stability of this path. Positive signals are emerging from the relative strength indicators after the price successfully relieved its overbought conditions, giving it more room to achieve further gains in the near term. However, the price is still facing negative pressure from trading below EMA50, which could hinder its progress in the short term.
Brent crude oil shows further negative signals - Analysis- 25-03-2026
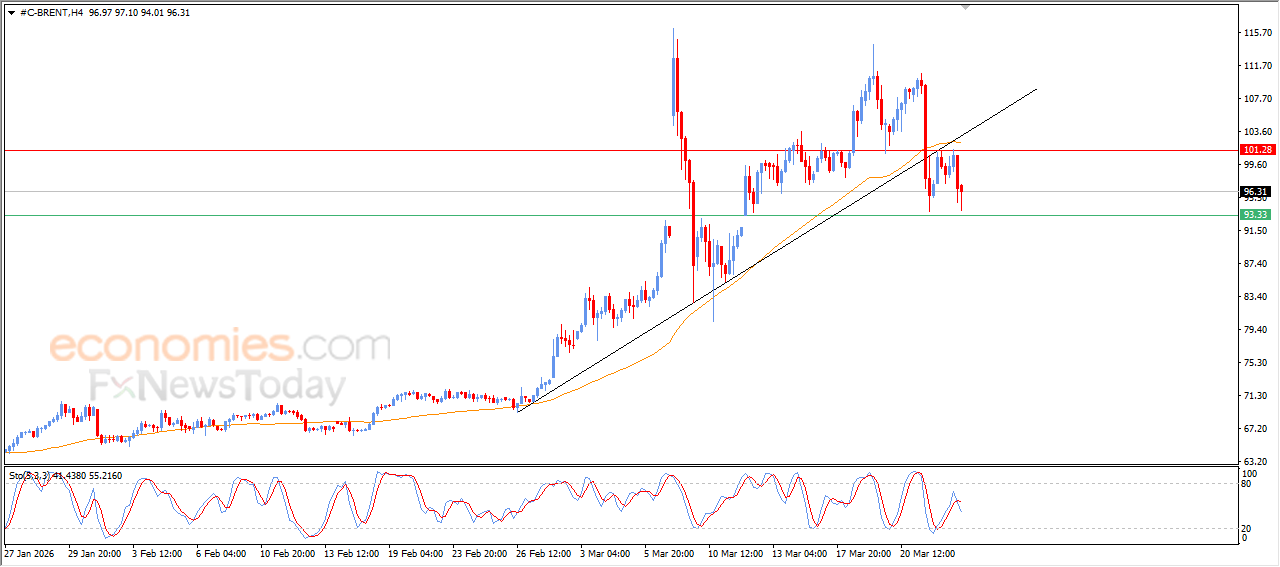
Brent crude oil prices declined during their recent intraday trading, amid ongoing negative pressure due to trading below EMA50. A short-term bearish corrective wave continues to dominate, affected by the earlier break of a major upward trendline, and negative signals are emerging from the relative strength indicators after the price managed to relieve its oversold conditions, which amplifies the surrounding downward pressure in the coming period.