Oil Price Breaks Downward Trendline – Today's Forecast – 18-03-2025

The price of crude oil has risen in recent intraday trading, confirming the break of a short-term downward sub-trendline.
This move is supported by its continuous trading above its 50-day simple moving average.
Additionally, it is trading along an upward corrective trendline, with the onset of a positive RSI crossover after the indicator reached significantly exaggerated oversold levels relative to the price movement.
Our forecast indicates further corrective upward movement for oil in the upcoming sessions, especially if it manages to break the resistance at $67.95.
Such a breakthrough would confirm the bullish double bottom pattern, with the price then targeting the resistance level at $70.00 as the next price target.
To get our more detailed analysis and 100% accurate signals provided by Best Trading Signal, subscribe to Economies.com VIP Club through the link below!
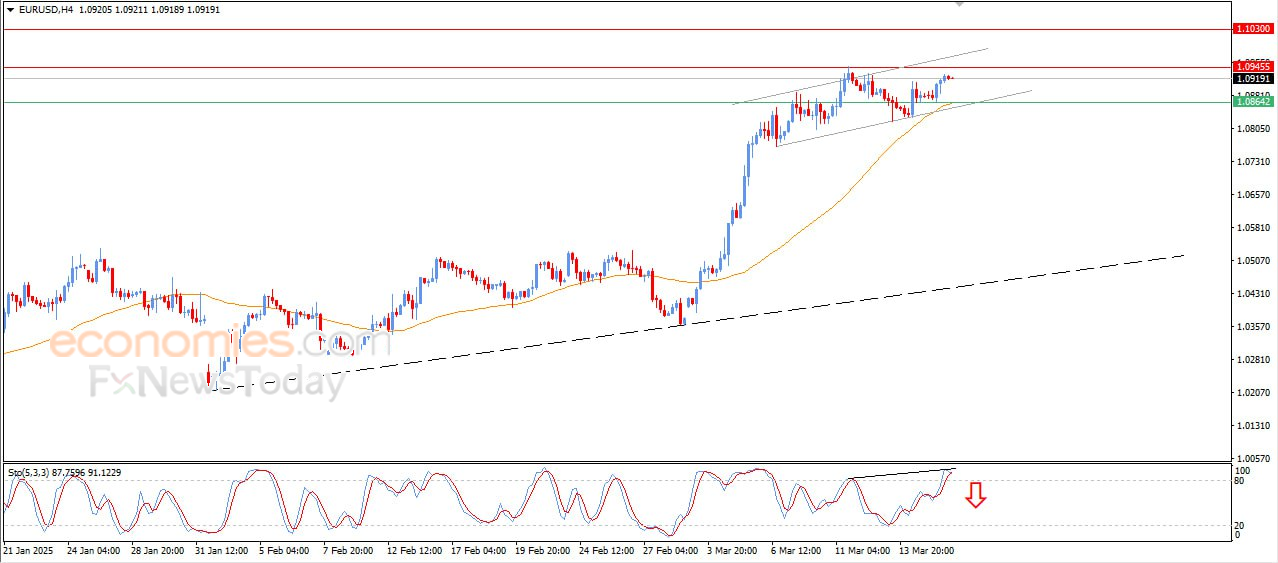
EUR/USD Faces Strong Resistance – Today's Forecast – 18-03-2025
Intraday Movement:
The EUR/USD pair is trading higher at intraday levels, supported by the dominant primary uptrend and continuous buying pressure above its 50-day simple moving average.
However, as the pair nears the pivotal resistance at 1.0945, it faces some downward pressure.
RSI Concerns:
A negative divergence is starting to form on the RSI after it reached severely overbought levels—this exaggerated overbought condition, along with the onset of a negative crossover, is weighing on the price.
Outlook:
Although our overall bullish view on the pair remains intact, we might see some corrective declines because the pair needs to shed part of its overbought condition to break the 1.0945 resistance.
This could lead to a retest of the support at 1.0860.
Conversely, if the pair manages to break through the resistance, the next target would be 1.1030.
To get our more detailed analysis and 100% accurate signals provided by Best Trading Signal, subscribe to Economies.com VIP Club through the link below!
Gold Price Attacks a Key Resistance – Today's Forecast – 18-03-2025
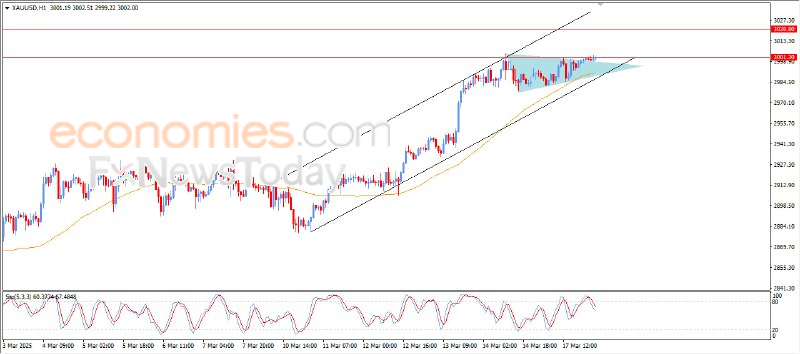
Gold (GOLD) has stabilized with an upward bias during recent intraday trading.
The price is attempting to break through the main and psychological resistance at $3,000.
This move is supported by trading within a short-term ascending price channel and continuous positive momentum from trading above its 50-period simple moving average, along with the formation of a complementary bullish chart pattern—the symmetrical triangle.
However, negative signals from the RSI have emerged as it reaches overbought territory, which is tempering the upward move by prompting profit-taking.
We expect gold's price to rise in the upcoming sessions, particularly if it manages to break the $3,000 resistance level.
Once this resistance is breached, the next target will be the initial resistance at $3,020.
To get our more detailed analysis and 100% accurate signals provided by Best Trading Signal, subscribe to Economies.com VIP Club through the link below!
Brent Crude Oil Price Forecast Update – 17-03-2025

Brent crude is currently attacking the key resistance level at $71.18. A breakthrough of this level represents a new positive impulse for the upcoming price action.
This level forms the neckline of a bullish technical pattern on the short-term chart—the double bottom—supported by its continuous trading above the 50-day simple moving average and positive RSI signals, despite reaching overbought territory.
Bullish Scenario:
Our forecast hinges on breaking the $71.18 resistance. If the price manages to break through, it is expected to continue its ascent toward the next resistance level at $73.90.
The positive scenario remains intact as long as the support at $69.50 holds.
To get our more detailed analysis and 100% accurate signals provided by Best Trading Signal, subscribe to Economies.com VIP Club through the link below!