Forecast update for crude oil -23-02-2026
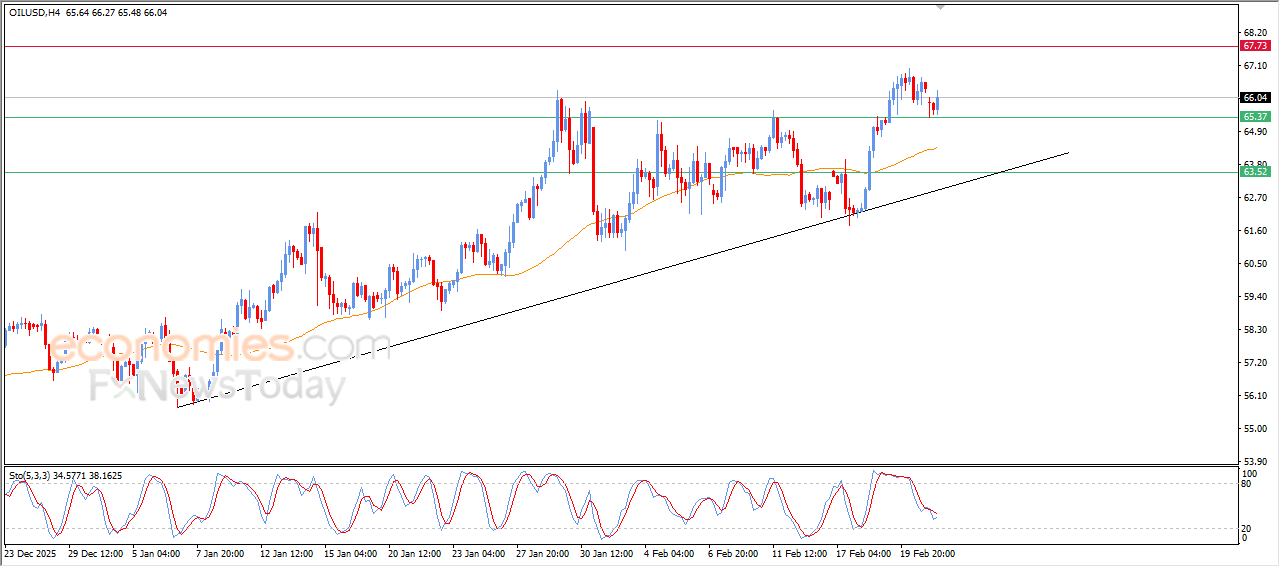
The price of (crude oil) rose in its last trading on the intraday levels, taking advantage of the support level stability at $65.35, gaining bullish momentum that helped it to achieve these gains, amid the dominance of the main bullish trend on short-term basis, with its trading alongside supportive trend line for this path, besides the continuation of the positive pressure due to its trading above EMA50, renewing the bullish momentum.
Forecast update for silver -23-02-2026
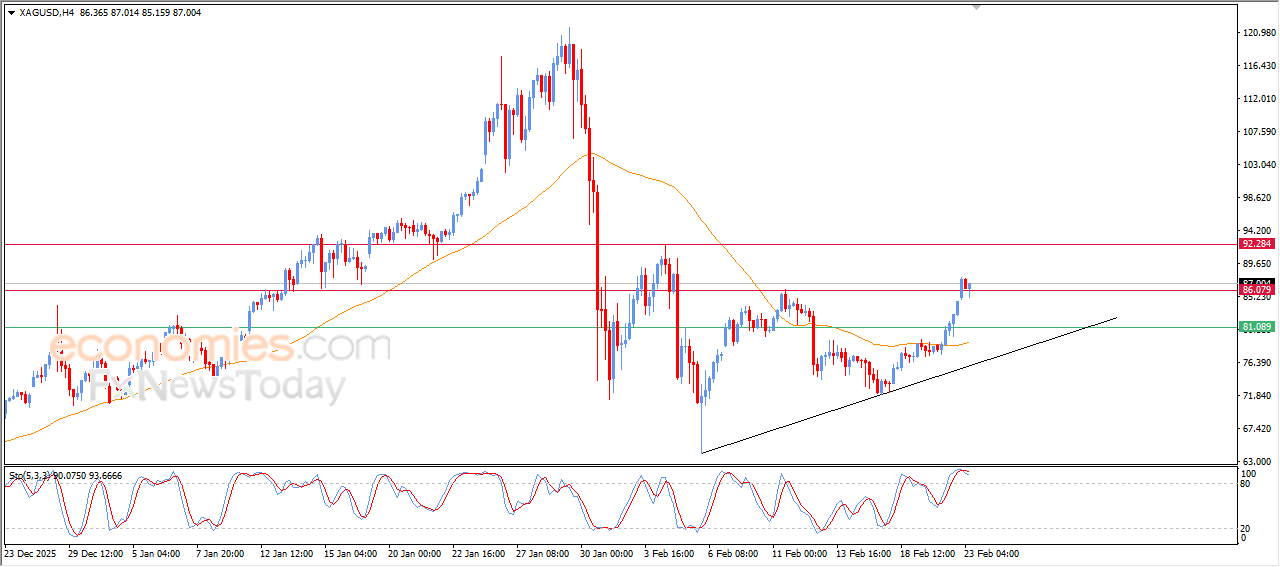
The price of (silver) rose in its last intraday trading, to confirm breaching the key resistance at $86.00, amid the continuation of the dynamic support that is represented by its trading above EMA50, reinforcing the stability and dominance of minor bullish wave on short-term basis, on the other hand, we notice the emergence of negative signals from relative strength indicators, after reaching overbought levels, which might reduce the gains in near period.
Forecast update for gold -23-02-2026.
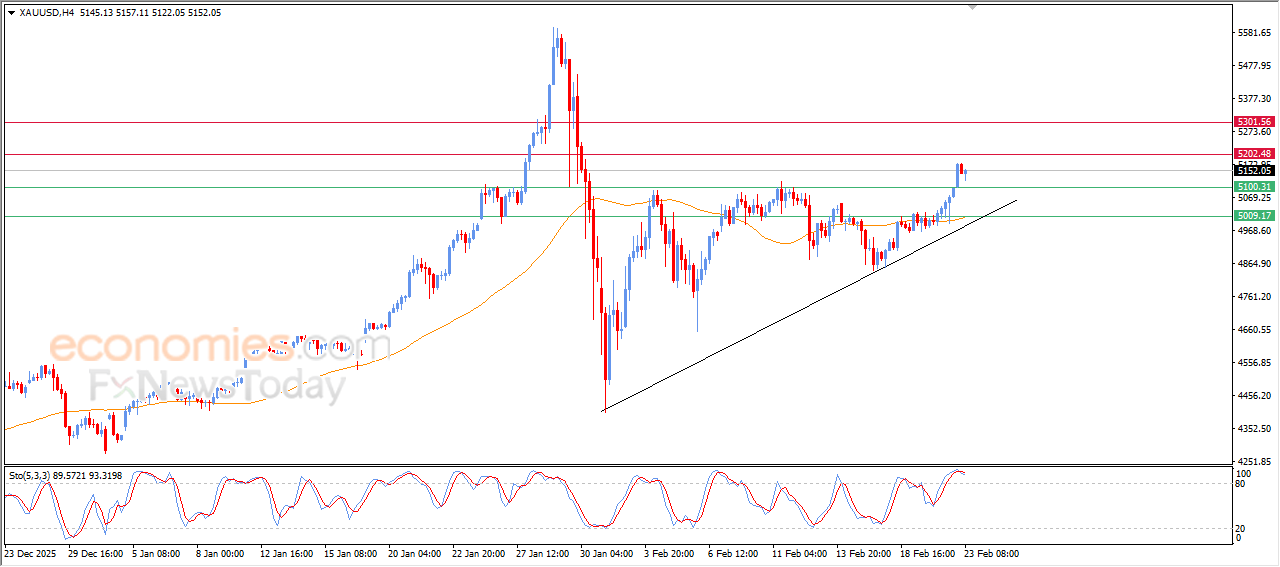
The price of gold declined in its last intraday trading, to gather the gains of its previous rises, attempting to offload some of its clear overbought on relative strength indicators, especially with the emergence of the negative signals from them, to gather its positive strength that might help it to resume its gains, amid the continuation of the positive support due to its trading above EMA50, with its trading alongside minor bullish trend line on short-term basis.
Forecast update for EURUSD -23-02-2026.
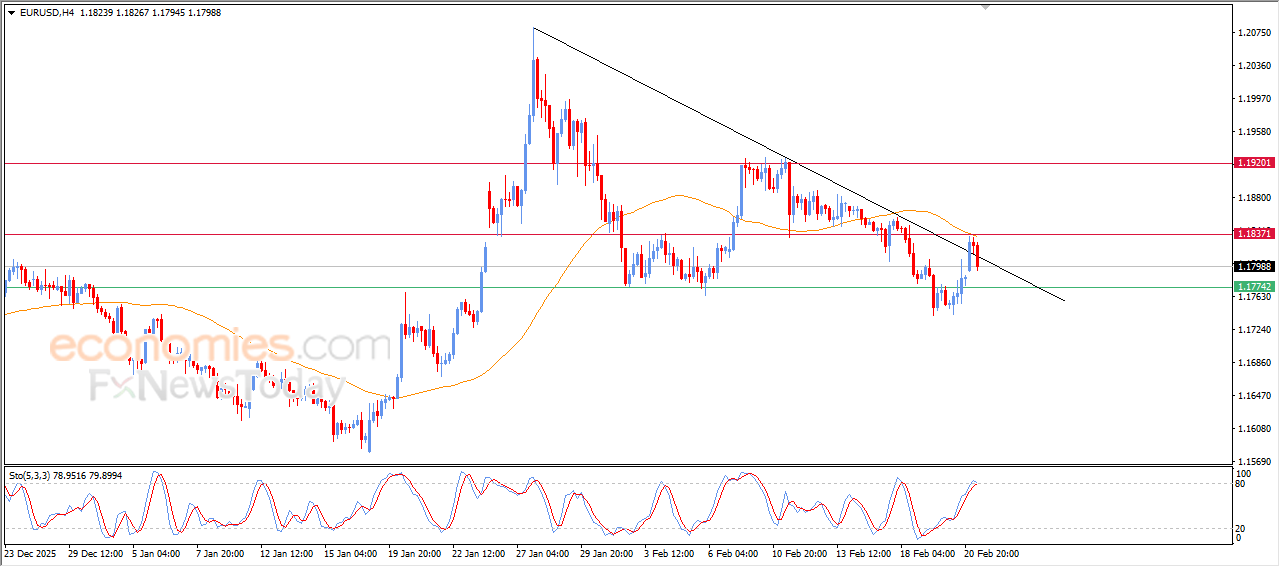
The price of EURUSD declined in its last intraday trading, due to the stability of the resistance at 1.1835 resistance level, affected by reaching EMA50’s resistance, which put it under intensive negative pressure, especially with the emergence of negative overlapping signals from relative strength indicators, after reaching exaggerated overbought levels on relative strength indicators, indicating the beginning of negative divergence that might increase the negative pressure on the price.