


 |
Evening update for Crude oil -11-09-2026
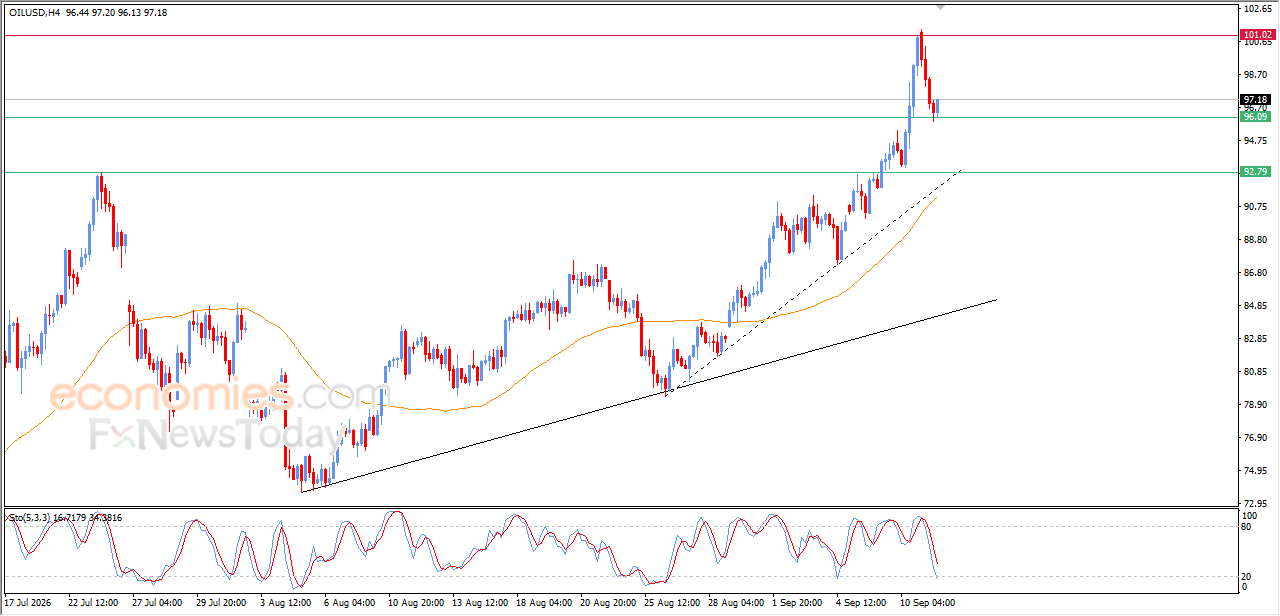
Crude oil rose in its latest intraday trading, after a downside journey to look for a higher low for leaning on $96.00 support, as the relative strength indicator entered exaggerated oversold levels compared to the price action, amid the dominance of the main bullish trend on the short-term, with the continuation of the positive pressure that comes from its trading above EMA50, attempting to recover and rise again.
Thanks for your feedback.
Evening update for gold -11-09-2026
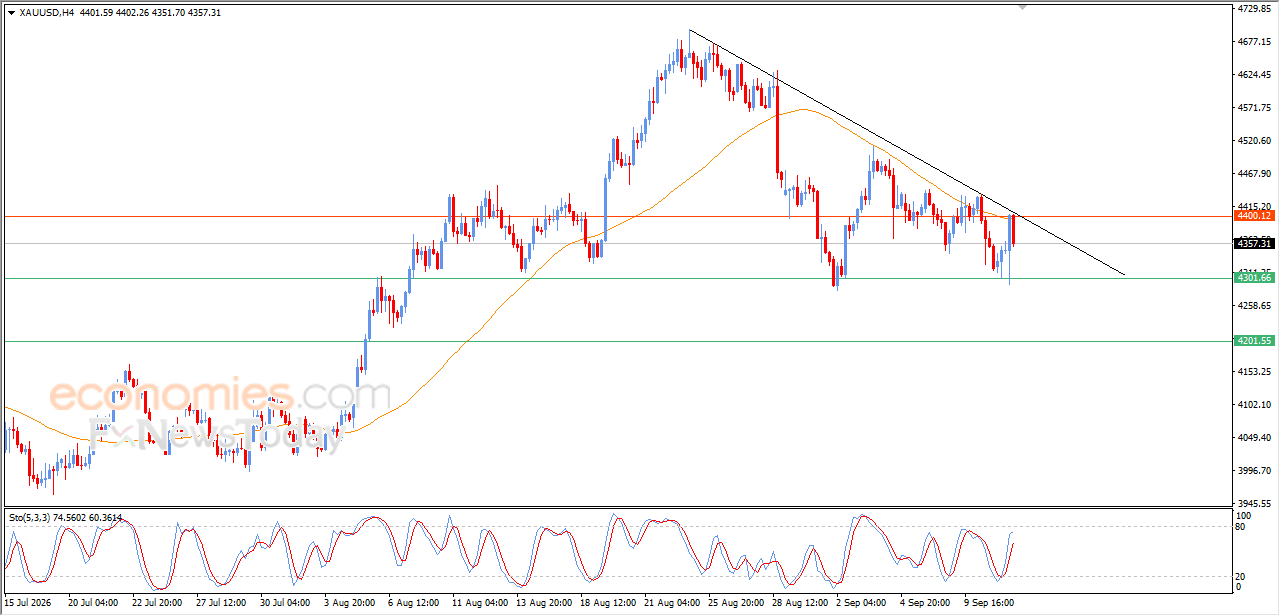
Gold price witnessed mixed trading on its latest intraday levels, after reaching our morning expected target for today at $4,300 support, which provided bullish momentum that helped it to rebound higher, reaching EMA50’s resistance, accompanied by testing bearish corrective trend line on the short-term basis, to surrender to these negative pressures and decline once again, after offloading its oversold conditions on the relative strength indicators, increasing the negative pressure around it.
MoreEvening update for EURUSD-11-09-2026

The EURUSD pair bounced higher in its latest intraday trading, due to the stability of the key support at 1.1565, which was a price target in our previous analysis, gaining some bullish momentum that helped it to achieve limited gains, supported by the emergence of the positive signals from the relative strength indicators, after reaching oversold levels, reaching EMA50’s resistance, which stopped these gains and left it vulnerable to renewed downside pressure, affected by breaking a main bullish trend line previously on the short-term basis.
MoreForecast update for Ethereum -11-09-2026

The price of Ethereum resumed its decline during its latest intraday trading after reaching EMA50’s resistance, exposing the price to negative pressure, especially as a bearish crossover begins to emerge on the relative strength indicators after they reached severely overbought levels, to suggest the beginning of a negative divergence, which could intensify the negative pressure on the price, amid the dominance of a sideways wave controlling price movements in the short term.
More