Crude oil prices are losing the balance after breaking trend line- Analysis-16-02-2026
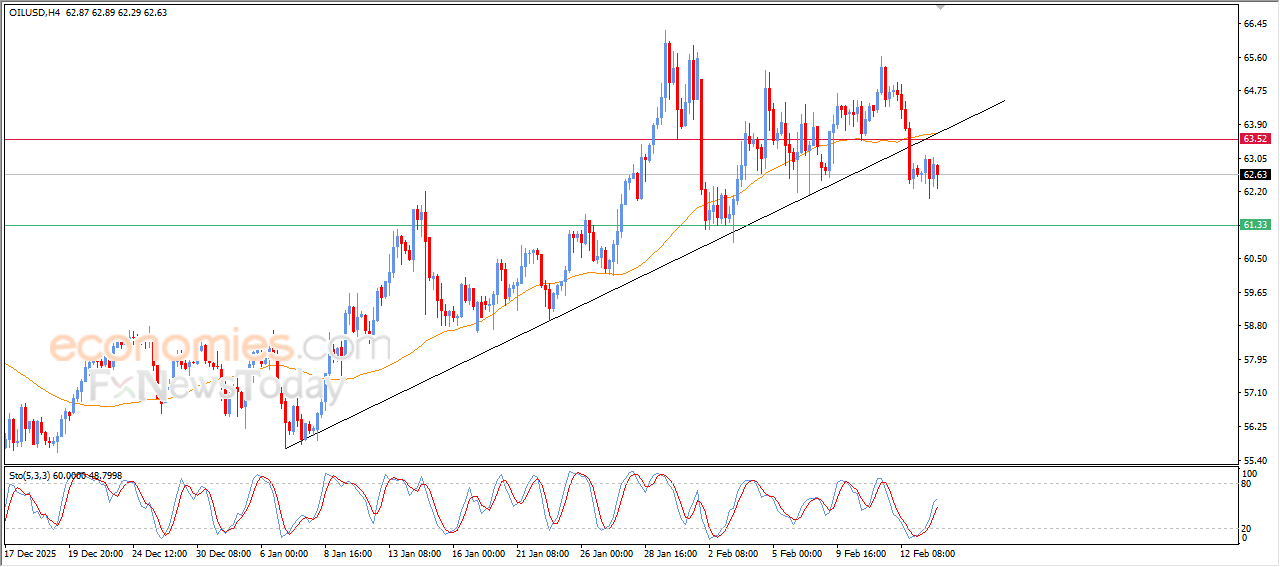
Crude oil prices declined in their last trading on intraday levels, affected by breaking main bullish trend line on short-term basis, which changed the technical overview and brought the negative pressures back to the forefront once again. This pressure continues with the price stability below EMA50, to form a solid barrier against any serious recovery attempts in near-term basis.
At the same time, the relative strength indicators began showing negative overlapping signals, after offloading the previous oversold conditions, opening the way for extending the bearish trading and recording extra losses in the upcoming period.
Silver Price is showing more negative signals– Analysis-16-02-2026
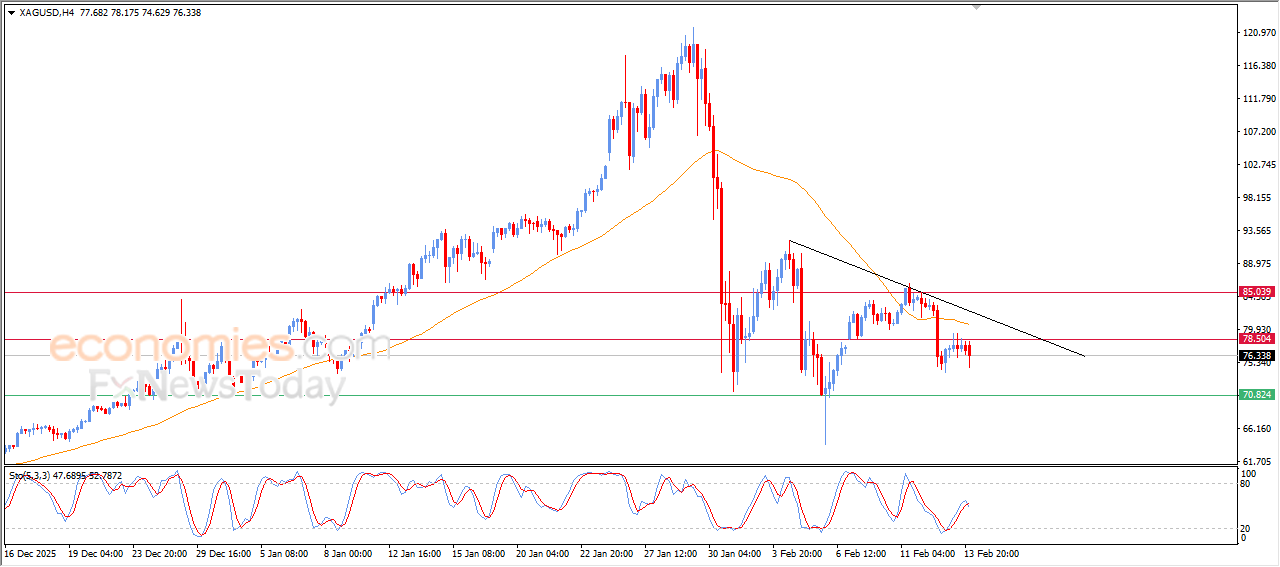
Silver prices (SILVER) declined in their recent intraday trading, to remain under the dominance of bearish corrective trend on short-term basis, with the continuation of its trading alongside minor trend line that reinforces this track, and the scene becomes darker with the stability of the price below EMA50, which might put extra negative pressure and limit the chances of sustainable recover soon.
The relative strength indicators began showing new negative overlapping signals after offloading their previous oversold conditions, opening the way for another bearish wave that might push the price to decline
Gold price struggle to breach psychological resistance- Analysis-16-02-2026
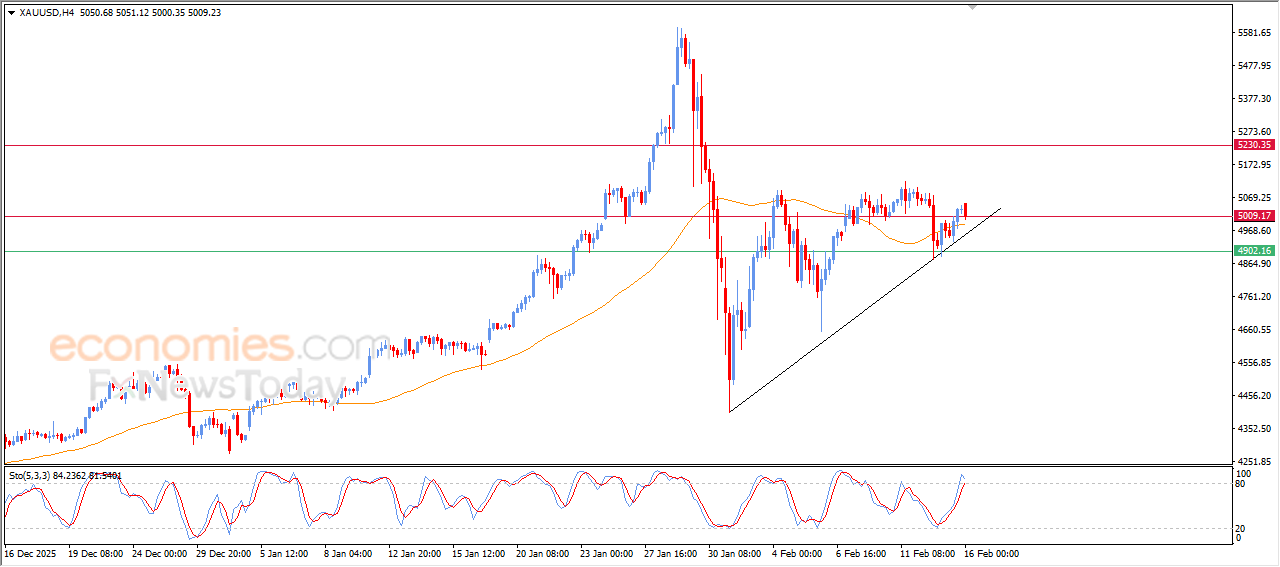
Gold prices declined in recent intraday trading, in attempt to reorganize the ranks and gain new momentum that might help it to breach the key psychological resistance at $5,000, leaning on key dynamic support due to its stability above EMA50, keeping the dominance of the minor bullish wave on short-term basis, especially with the continuation of the trading alongside supportive trend line.
On the other hand, the relative strength indicators are approaching sharp overbought levels exaggeratedly compared to the price move, indicating a likelihood of forming negative divergence that might put pressure on the upcoming trading and obstructs completing the recovery.
EURUSD price is between trend support and indicators pressure- Analysis-16-02-2026
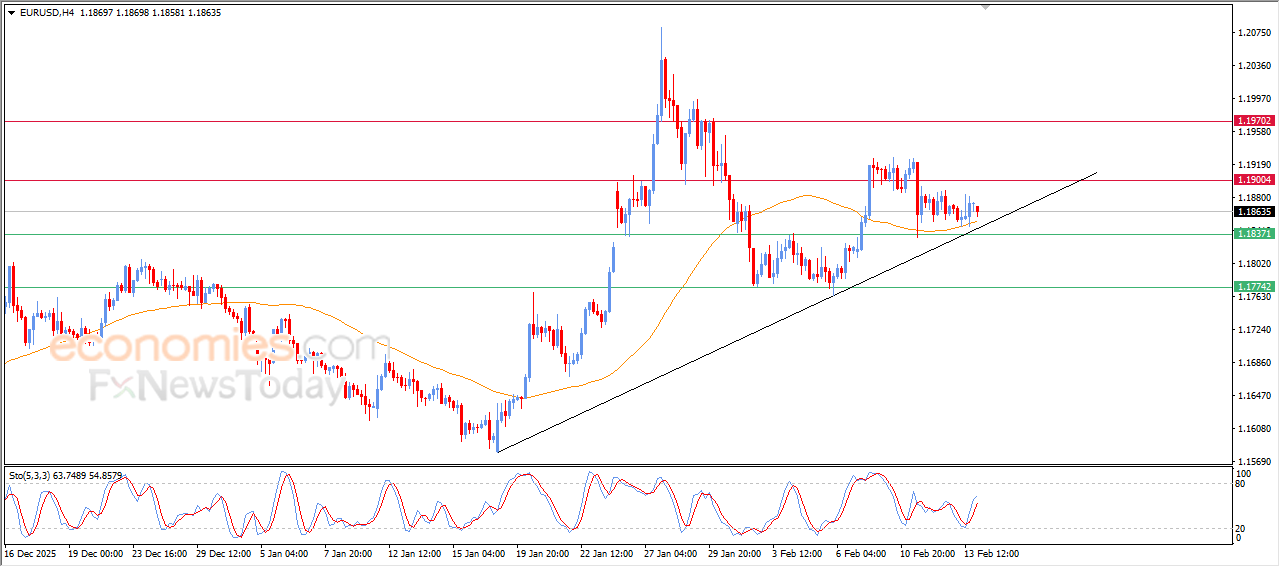
The (EURUSD) price continues its fluctuating trading in its last intraday trading, attempting to build bullish momentum to ease the way for regaining the upside track, getting significant support by its stability above EMA50, which reinforces the chances of the recovery on near-term basis, especially with the continuation of its trading alongside main bullish trend line that detect the short-term trend lines.
On the other hand, there are negative signals from relative strength indicators, which might limit the price rally and keep the cautiousness valid.