


 |
|
Crude Oil Price Remains Under Bearish Pressure – Analysis – 27-05-2026
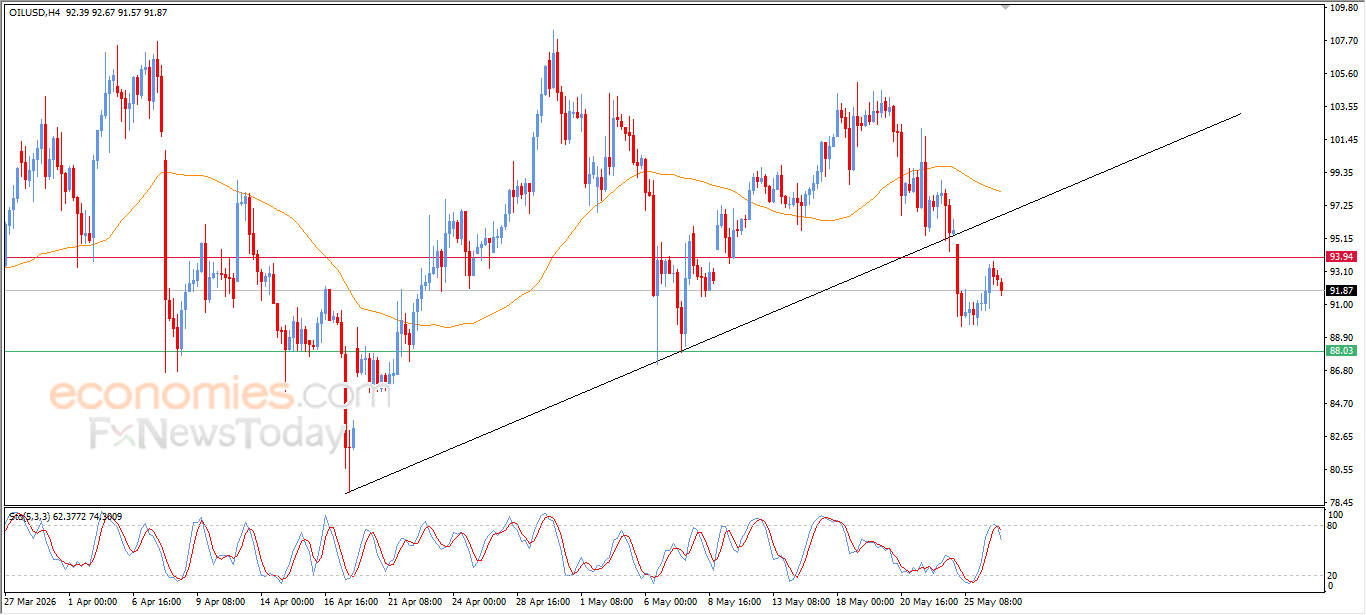
Crude oil prices declined in recent intraday trading amid growing negative pressure, as clear bearish signals started to appear on the relative strength indicators after reaching heavily overbought levels compared to price action. This led to the formation of a negative divergence, increasing the likelihood of continued selling pressure in the near term.
Oil also remains affected by the break below a key short-term bullish trend line, while continuing to trade under EMA50, making a full recovery more difficult for now and keeping the bearish technical outlook dominant unless stronger reversal signals emerge.
Silver Price Prepares to Challenge Key Resistance – Analysis – 27-05-2026
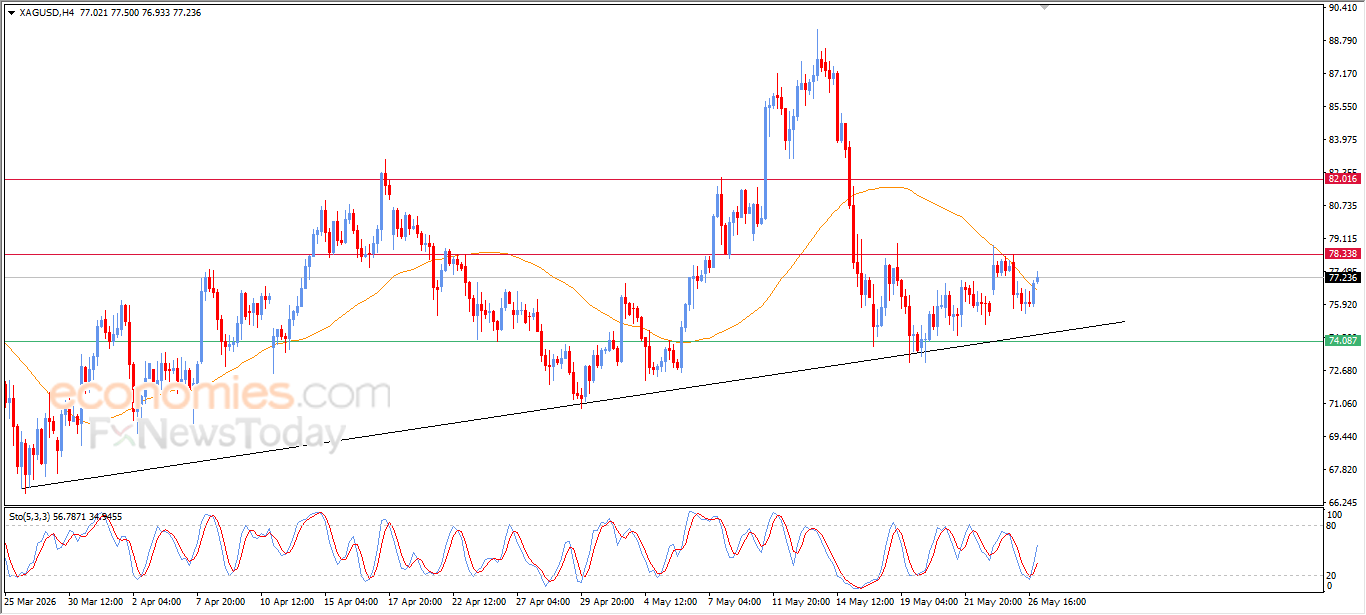
Silver prices moved higher during recent intraday trading and are now preparing to test the key resistance level at $78.35, supported by improving technical momentum after positive signals emerged from the relative strength indicators, especially following the formation of a positive divergence that helped the metal achieve consecutive gains recently.
MoreGold Price Shows Mixed Signals – Analysis – 27-05-2026
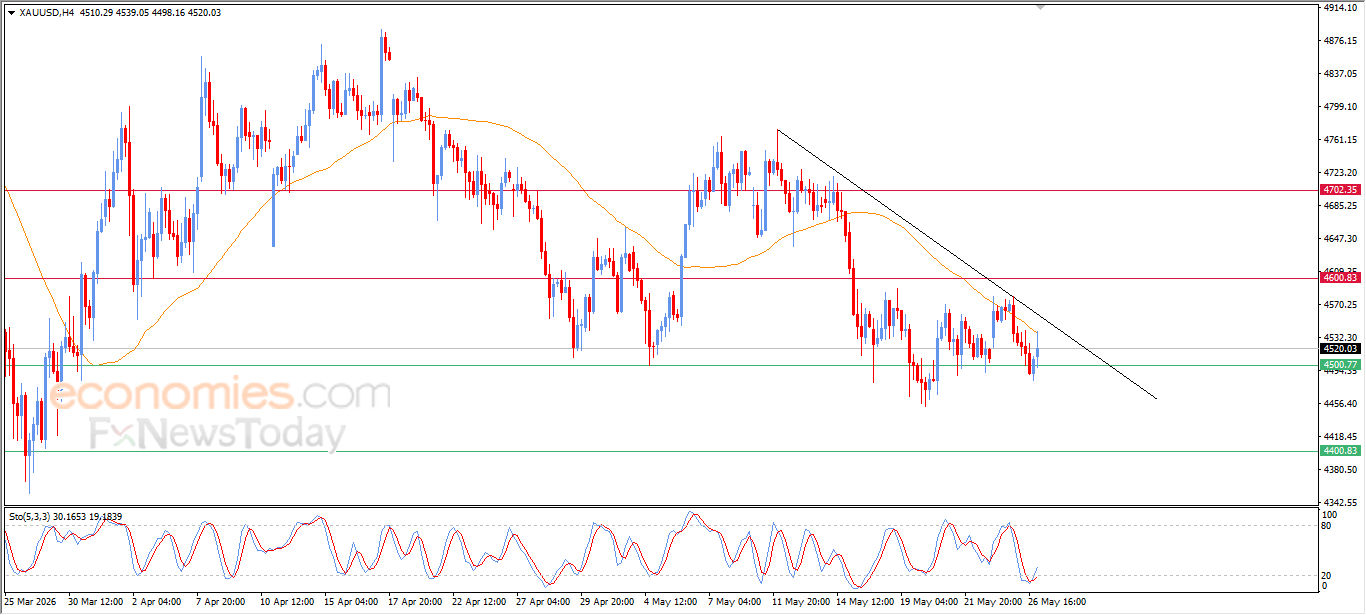
Gold prices rose in recent intraday trading, supported by the formation of a positive divergence on the relative strength indicators after reaching deeply oversold levels compared to price action, which improved momentum and generated positive signals supporting the current recovery attempts.
MoreEURUSD Gains Support – Analysis – 27-05-2026
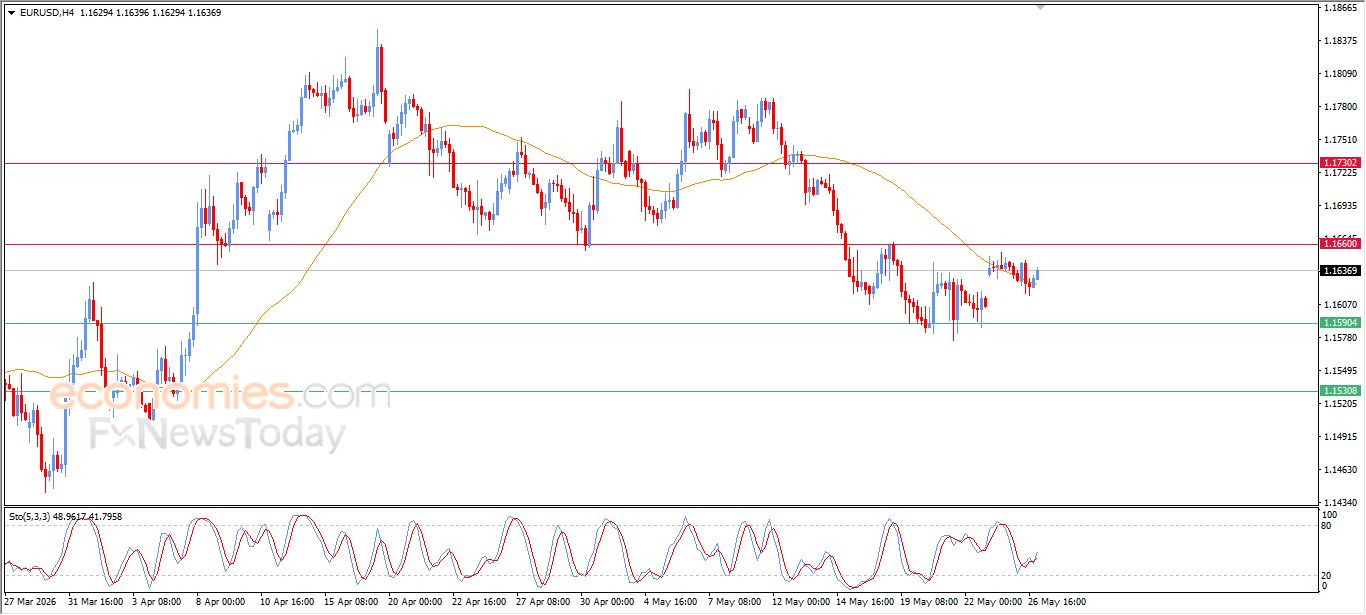
EURUSD moved higher in recent intraday trading after finding support at EMA50, helping the pair gain positive momentum and extend its short-term gains as bullish technical signals improved.
More