Crude oil begins 2025 with a stunning start... These are the reasons behind it
Energy Markets Experienced a Strong Start at the Beginning of 2025
Energy markets experienced a strong start at the beginning of 2025, with global oil prices jumping to their highest levels in five months, registering a notable increase of an average of 10%.
This significant rise was driven by growing concerns over the potential reduction of Russian crude oil supplies to the global market, especially after the United States imposed a new round of sanctions on Russia's energy sector.
Additionally, rising expectations of improved global demand, particularly with the strong economic growth led by the United States alongside intensive measures to stimulate the Chinese economy, contributed to this surge.
Recent decisions by the OPEC+ alliance also played a crucial role in determining the price trajectory, as an extension of production restrictions was announced to better balance supply and demand in the market.
On the other hand, geopolitical tensions in some oil-producing regions have heightened concerns among traders about supply stability. This has led to increased insurance costs for shipments, which in turn has impacted prices.
Furthermore, the decline in U.S. inventories has boosted optimism about market recovery, with recent data showing a significant drop in commercial stocks.
In light of these developments, energy experts expect the positive momentum of oil prices to continue during the first quarter of the year, with expectations of further increases if current conditions persist. However, the market remains sensitive to any sudden changes that might affect supply or demand.
This report details the main reasons behind the surge in oil prices, with a comprehensive analysis of future trends that may determine the market's path in the coming months.
Price Outlook
- Since the beginning of 2025, the price of U.S. crude oil has risen by more than 10%, reaching its highest level in five months at $79.19 per barrel during trading on January 13.
- Brent crude oil prices increased by 9.25%, reaching $81.64 per barrel on January 13, the highest level since August 2024.
US Sanctions on Russia
On January 10, 2025, the United States imposed a new package of sanctions on Russia's energy sector, targeting major companies such as "Gazprom Neft" and "Surgutneftegaz," in addition to over 180 oil tankers.
These measures aim to reduce Russia's revenues from oil and gas exports, as part of ongoing efforts to pressure Moscow due to the ongoing war in Ukraine.
Details of the Sanctions
- Targeted Companies: The sanctions include "Gazprom Neft" and "Surgutneftegaz," two of Russia's largest oil producers.
- Oil Tankers: Approximately 183 ships were listed in the sanctions, hindering their ability to transport Russian oil to global markets.
Reactions
- The Kremlin: Kremlin spokesperson Dmitry Peskov expressed concern that these sanctions could destabilize global energy markets, emphasizing that such decisions do not contribute to market stability.
- International Analysts: Energy experts indicated that these sanctions could increase pressures on global oil markets, leading to higher prices and supply fluctuations.
Potential Impact
These sanctions are expected to affect Russia's ability to export oil and gas, potentially reducing its revenues from the energy sector. They may also cause disruptions in global energy markets, given Russia's prominent role as a major source of oil and gas.
Top Russian Crude Oil Importers
In 2024, India and China emerged as the largest importers of Russian crude oil, benefiting from competitive prices and discounts offered by Moscow amidst Western sanctions.
India
- Import Volume: India imported approximately 1.64 million barrels per day of Russian oil during the 2023-2024 fiscal year, representing a 57% increase compared to the previous year.
- Share of Total Imports: Russian oil accounted for about 35% of India's total crude imports, compared to 22% in the previous year.
- Impact on Other Sources: This shift led to a decrease in the Middle East oil share in India's imports to 46%, the lowest level ever.
China
- Import Volume: China's imports of Russian oil increased by 17% since the beginning of 2024, reaching 37.79 million tons, equivalent to approximately 2.28 million barrels per day.
- Share of Total Imports: Russian oil constituted about 22% of China's total crude imports, compared to 18% in the previous year, reflecting increased reliance on Russian oil due to competitive prices.
- Impact on Other Sources: This shift resulted in a reduction in the share of traditional suppliers, such as Saudi Arabia, whose exports to China declined by 8% compared to the previous year.
- It also affected oil imports from the United States and Africa, as China preferred Russian oil due to its lower cost and the favorable payment terms offered by Moscow.
Turkey
- Share of Imports: Turkey accounted for about 7% of Russia's total crude oil exports from December 2022 to December 2024.
European Union
- Share of Imports: Despite the sanctions, the European Union imported about 6% of Russia's total crude oil exports during the same period.
This shift in oil flows reflects a reshaping of the global energy map, as Russia seeks to strengthen its relations with Asian countries to overcome the impact of Western sanctions, while countries like India and China benefit from opportunities to obtain oil at discounted prices.
Opinions and Analyses on the Sanctions
Traders and analysts have stated that Russian oil exports will be severely affected by the new sanctions, pushing China and India to obtain more crude from the Middle East, Africa, and the Americas, which will drive up prices and shipping costs.
- Analyst at BVM "Tamas Farga": There are real concerns in the market about supply disruptions from Russia. It seems that the worst-case scenario for Russian oil could become a reality.
- Farga added: However, it is unclear what will happen when "Donald Trump" takes office next week. Farga clarified that the sanctions include a cooling-off period until March 12, so there may not be significant disruptions until now.
- Goldman Sachs estimates: The ships targeted by the new sanctions transported 1.7 million barrels per day of oil in 2024, or 25% of Russia's exports.
- Analysts wrote in a memo: Goldman Sachs: It is increasingly likely that its Brent range forecast between $70 and $85 per barrel will lean upwards.
- Analysts at RBC Capital Markets: Doubling the number of tankers sanctioned to transport Russian barrels could pose a significant logistical problem affecting crude oil flows.
- Head of Research at Onix Capital Group "Harry Chelengiorian": The latest round of sanctions by the U.S. Office of Foreign Assets Control targeting Russian oil companies and a large number of tankers will have particularly severe consequences for India.
- Analysts at JP Morgan: Russia has some room to maneuver despite the new sanctions, but it will ultimately need to acquire unsanctioned tankers or offer crude at $60 per barrel or less to use Western insurance as stipulated in the Western price cap.
- Market Strategist at IG "Yap Jon Rong": The main headlines surrounding Russian oil sanctions have been the dominant driver of oil prices recently, coupled with resilient U.S. economic data, witnessing tighter supply and demand dynamics some momentum.
- Rong added: With prices rising rapidly and sharply by about 10% since the beginning of the year, it is driving profit-taking activity with some risks emerging around upcoming U.S. inflation data releases.
- Analysts at ING in a memo: These sanctions have the potential to pull up to 700,000 barrels per day from the market's supply, which would erase the surplus we expect this year.
- Analysts added: However, the actual decline in flows is likely to be less, as Russia and buyers find ways to circumvent these sanctions, and it is clear there will be more pressure on unsanctioned ships within the shadow fleet.
- Philip Jones Lux from Sparta Commodities: The new sanctions on Russian tankers are expected to affect crude supplies to China and India, although the main players in these countries are still assessing the legal situation and possible solutions.
Extension of OPEC+ Production Cuts
In December last year, the OPEC+ alliance announced an extension of oil production cuts by two million barrels per day for an additional year, until the end of 2026 instead of 2025, as part of its ongoing efforts to support the stability of global oil markets and enhance the balance between supply and demand.
Additionally, the eight countries contributing to the voluntary oil production cuts, amounting to 2.2 million barrels per day, decided to extend the timeline for lifting these cuts by an additional three months, so they end at the end of March 2025 instead of the previous deadline at the end of the current December.
OPEC+ members are currently implementing production cuts totaling 5.9 million barrels per day, equivalent to about 5.7% of global demand.
- Included Cuts: Two million barrels per day from OPEC+ members continue until the end of 2026 after the latest decision.
- Contributed by 9 Member Countries: (Saudi Arabia, UAE, Iraq, Kuwait, Kazakhstan, Algeria, Oman, Gabon, and Russia) reducing production by 1.7 million barrels per day, ending by the end of 2025.
- Additional Voluntary Cuts: Eight countries (Saudi Arabia, Russia, UAE, Kuwait, Algeria, Oman, Iraq, and Kazakhstan) agreed to implement additional voluntary production cuts amounting to 2.2 million barrels per day, to end by the end of March 2025.
Harsh Weather and Global Demand
Harsh weather in Europe and the United States has had a notable impact on oil markets recently, as unusual weather conditions have contributed to increased demand for fuel and higher prices. The main impacts are as follows:
- Increased Demand for Heating Fuel: A sharp drop in temperatures in Europe and the United States has led to increased consumption of heating fuels, such as diesel and heating oil. This rise in demand for refined products has put pressure on refineries and increased crude oil prices, the primary source of these products.
- Production and Transportation Disruptions: In the United States, snowstorms and ice have led to the closure of some oil fields, particularly in major production areas like Texas. Transportation networks and infrastructure have been disrupted, affecting producers' ability to deliver oil to local and international markets.
- Short-Term Price Boost: Cold weather has helped support oil prices, which have seen significant increases. For example, futures contracts for Brent crude and West Texas Intermediate (WTI) crude have risen with ongoing expectations of cold weather conditions.
- Impact on Inventories: Increased consumption of heating fuel has led to faster-than-expected draws from strategic inventories, especially in the United States, raising concerns about market balance. Energy Information Administration (EIA) data showed a larger-than-expected decline in inventories, prompting investors to buy more futures contracts in anticipation of potential shortages.
- Divergence in Global Demand: While demand for oil rose in Europe and the United States, demand in Asia remained relatively stable due to milder weather conditions. This divergence has helped mitigate the sharp rise in prices on a global level.
- Seasonal Factors: Although cold weather boosts oil demand during winter, the market is anticipating a return to milder temperatures in the coming months, which may lead to a gradual decline in prices. Outlook: If harsh weather continues longer than expected, the market may experience further upward pressure on prices. However, the return to climatic stability will rebalance supply and demand, especially if producing countries respond by increasing production to compensate for any shortages.
Global Interest Rate Cuts
Major central banks in the United States, Europe, the United Kingdom, Canada, and New Zealand continue to cut interest rates and ease tight monetary policies, aiming to halt the decline in economic activity and preserve achieved gains. Low interest rates typically reduce borrowing costs, which can boost economic activity and increase demand for oil.
Economic Stimulus in China
Chinese authorities took additional new stimulus measures during the last quarter of 2024 to support the country's weak economic activities, which will also reflect in improved oil demand levels in the world's largest crude importer.
Chinese authorities announced that they will adopt a "somewhat accommodative" monetary policy, according to an official statement issued by a meeting of senior Communist Party officials, a term last used in 2010 when they sought to support recovery from the global financial crisis.
According to the ruling party's political office, the country will adopt a "sufficiently accommodative" monetary policy in 2025, alongside a more proactive fiscal policy to stimulate economic growth.
Key Challenges Affecting Oil Prices in 2025
The crude oil market in 2025 faces numerous challenges that could significantly impact its prices, including the following:
- Continued Geopolitical Uncertainty:
- The ongoing war in Ukraine and tensions in the Middle East cast shadows over oil markets, leading to significant price volatility.
- The war in Ukraine continues with no clear solutions in sight, keeping oil prices in a state of uncertainty.
- China escalates its claims of sovereignty over Taiwan, raising fears of a war between the two countries.
- Many countries impose sanctions on some oil-producing nations.
- Global Economic Slowdown:
- A slowdown in global economic growth could lead to a decrease in fuel demand.
- Many major global economies face recession risks this year, casting a gloomy shadow on oil demand forecasts and price declines.
- Increased Production from Non-OPEC+ Countries:
- Some non-OPEC+ countries, such as the United States and Canada, are seeking to increase their oil production. This could lead to an oversupply in the market and negatively pressure prices.
- Shift Towards Renewable Energy:
- Many countries are aiming to reduce their reliance on fossil fuels and transition to renewable energy sources.
- The shift to renewable energy in the long term could lead to a decrease in oil demand and exert downward pressure on prices.
- Climate Change Concerns:
- Concerns about climate change are increasing pressure on governments and companies to reduce carbon emissions.
- These pressures could lead to restrictions on oil usage and a decline in demand and prices.
Top Oil Price Forecasts for 2025
- Bank of America expects oil prices to stabilize around $80 per barrel this year.
- Goldman Sachs Group forecasts oil prices to rise to $80 per barrel this year.
- Citibank Group expects oil prices to stabilize around $75 per barrel this year.
- Morgan Stanley Group forecasted oil prices to reach $75 per barrel by the end of 2025.
- Deutsche Bank expects oil prices to reach $90 per barrel by the end of 2025, citing supply shortages as a key factor supporting prices.
- Barclays Bank also raised its oil price forecasts by five dollars above the target price of $90 per barrel by the end of this year.
- Geoffries Financial Consulting Institute indicated that Brent crude could end the year at $95 per barrel.
- The World Bank expects the average Brent crude price to be $93 per barrel in 2025, attributing this to ongoing geopolitical tensions and OPEC+ production slowdowns.
- The International Energy Agency expects the average Brent crude price to be $90 per barrel in 2025.
- Argus Media expects the average Brent crude price to be $95 per barrel in 2025.
Best Oil Trading Companies January 2025
- Pepperstone - Best overall crude oil trading broker for beginners. Multiple regulated licenses. Founded 2010. Minimum deposit: $0. 20% discount on deposit.
- FPMarkets - Established 2005. Ideal for trading Crude Oil (WTI/Brent) with competitive spreads and fast execution. Minimum deposit: $100.
- Plus500 - Best licensed broker for investing in crude oil futures. Founded 2008. Multiple regulated licenses. Minimum deposit: $100.
- XM - Top crude oil WTI trading platform for educational materials and copy trading. Founded 2009. Multiple regulated licenses. Minimum deposit: $5. Periodic competitions and bonuses.


Technical Analysis of Crude Oil Prices
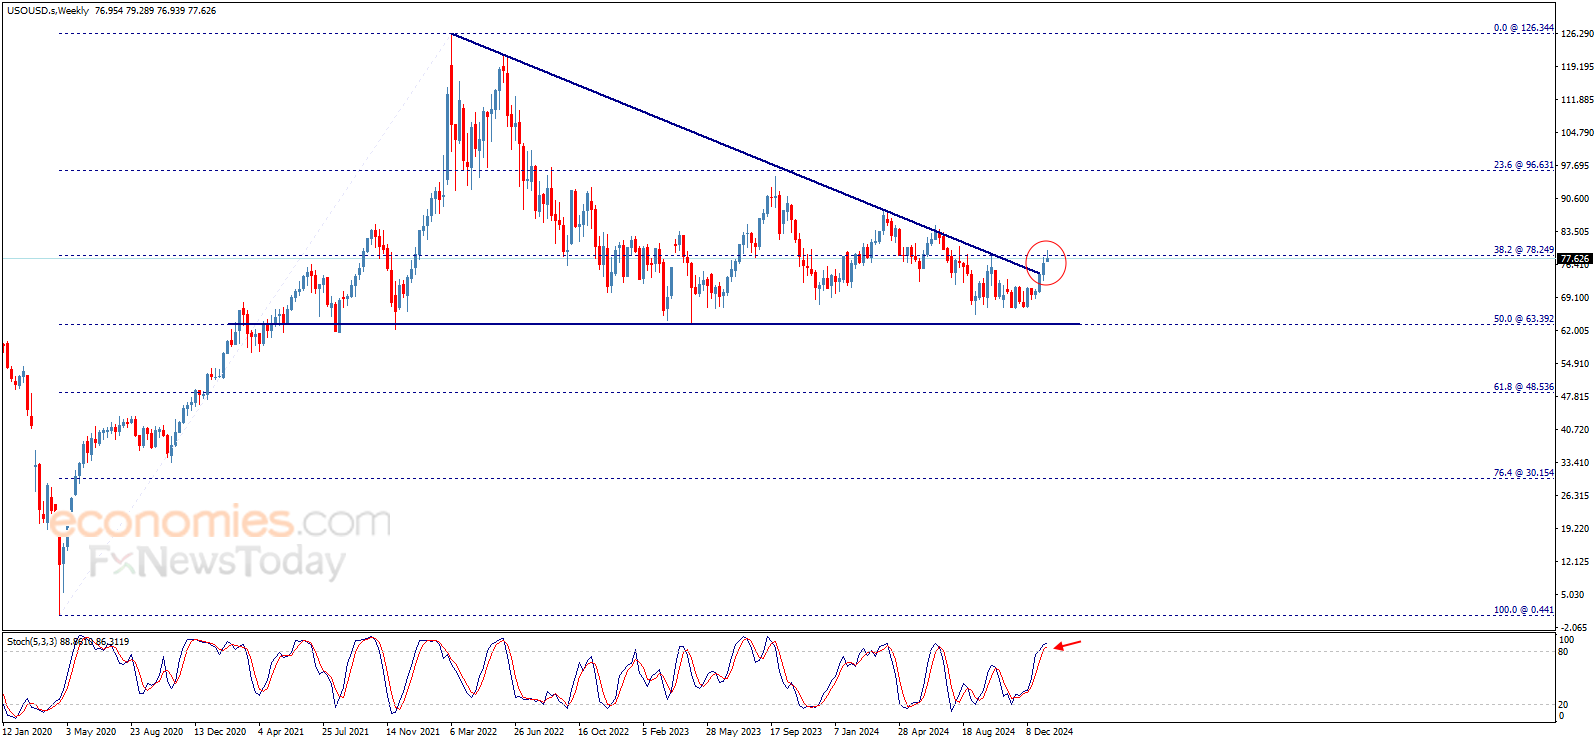
When applying the Fibonacci correction rule to different timeframes of oil prices, we find that there are signals suggesting the price direction towards recovering the upward trend in the medium to long term. After several attempts to reach the 50% Fibonacci level for the entire rise measured from historical lows around $0.44 to the recorded peak at $126.34, the price bounced upward and broke through a significant resistance level, as shown in the following weekly chart:

The price is attempting to break through the resistance level formed at the previously broken 38.2% Fibonacci correction level, forming a significant resistance at $78.25. Breaking this level represents a key confirmation for the continuation of the upward wave and the direction to achieve positive targets starting at $84.40 and extending to areas of $90.00 and then $96.60 in the medium term.
The Stochastic indicator shows negative signals on the weekly timeframe, which may hinder the price's task of achieving the required breakout at $78.25 and delay the confirmation of the breakout. This indicates that we need a weekly close above this level to confirm the continued rise.
On the other hand, on the daily timeframe, we find that the price began an upward correction from the recorded low in 2023 at $63.76. We observe that the price surpassed the 23.6% Fibonacci level to build more upward waves in the short term, targeting the visit to the 85.70% level as the next corrective target.

Continuing the application of Fibonacci corrections to different timeframes, the four-hour chart shows that the upward wave initiated by the price from the $67.05 area faced temporary downward retracements, followed by a resumption of the main upward trend. This contributed to pushing the price higher by forming ascending flag patterns, as shown in the chart below. Currently, the price is undergoing a downward correction that may lead it to test the $76.40 areas before resuming the upward wave again.

The recent trades are confined within a descending sub-channel forming a continuation flag pattern, meaning that breaking $78.90 will provide a good positive incentive supporting the continued upward trend in the upcoming period, aiming to achieve the aforementioned positive targets.
In summary, the expected overall trend for the upcoming period is upward, confirmed by breaking $78.25 and then $78.90, to receive positive incentives contributing to the surge towards levels of $84.40, then further to areas of $90.00 and $96.60.
Conversely, it is crucial to note that failing to confirm the breach of $78.90 and a downward rebound breaking the $74.60 level will force the price to turn downward, incurring new losses that could reach areas of $63.40 in the short term.
Fibonacci Levels
- 50% Fibonacci Level: A Fibonacci correction level reached from $0.44 to $126.34.
- 38.2% Fibonacci Level: A significant resistance level at $78.25.
- 23.6% Fibonacci Level: A corrective level on the daily timeframe at $85.70.
Technical Indicators
- Stochastic Indicator: Shows negative signals on the weekly timeframe, which may hinder the price's task of achieving the required breakout.
Four-Hour Chart
The four-hour chart shows that the upward wave initiated by the price from the $67.05 area faced temporary downward retracements, followed by a resumption of the main upward trend. This contributed to pushing the price higher by forming ascending flag patterns, as shown in the chart below. Currently, the price is undergoing a downward correction that may lead it to test the $76.40 areas before resuming the upward wave again.
Trading Channels
- Descending Sub-Channel: Recent trades are confined within a descending sub-channel forming a continuation flag pattern.
Summary
In summary, the expected overall trend for the upcoming period is upward, confirmed by breaking $78.25 and then $78.90, to receive positive incentives contributing to the surge towards levels of $84.40, then further to areas of $90.00 and $96.60.
Conversely, it is crucial to note that failing to confirm the breach of $78.90 and a downward rebound breaking the $74.60 level will force the price to turn downward, incurring new losses that could reach areas of $63.40 in the short term.
Conclusion
In conclusion, the expected overall trend for the upcoming period is upward based on technical analysis, with necessary confirmations at $78.25 and $78.90 levels to support the continuation of the upward trend and achieve positive targets. However, attention must be paid to critical support levels at $74.60 and $63.40 in the event of negative reversals.
Closing
The overall expected trend for the upcoming period is upward based on technical analysis, with the necessity to monitor vital support and resistance levels to ensure the achievement of desired targets and avoid potential risks.
Bonk price tries to vent off oversold saturation - Forecast today - 15-01-2025

Bonk’s currency price gained ground in the intraday levels after the current support of $0.00002479 held on, lending it some positive momentum as it tries to recoup some recent losses, while also venting off oversold saturation in the RSI, amid positive signals coming out of it, while the price trades alongside the downward correctional trend line in the short term, with negative pressure due to trading below the 50-day SMA.
Therefore we expect the price to return lower, provided the aforementioned support of $0.00002479 was reliably breached, thus targeting the next support at $0.00001506.
Trend forecast for today: Likely Bearish
Sui price returns higher - Forecast today - 15-01-2025

Sui’s currency price (SUIUSD) returned higher in the intraday levels, after leaning on the support of the 50-day SMA, lending the price some positive momentum, amid the dominance of the main upward trend in the short term, countered with negative signals from the RSI, which could impede upcoming gains.
Therefore we expect more gains for the price, targeting the pivotal resistance of $5.3700.
Trend forecast for today: Bullish
WLD price rises amid negative pressures - Forecast today - 15-01-2025

WLD’s currency price gained ground in the intraday levels amid the dominance of the main downward trend in the medium term, with negative pressure due to trading below the 50-day SMA, coupled with negative signals from the RSI despite reaching oversold levels, as the price tries to recoup some recent losses.
Therefore we expect the price to return lower, targeting the pivotal support of $1.28587183, provided the resistance of $2.80303775 holds on.
Trend forecast for today: Likely Bearish