Gold price declines under key resistance pressure - Analysis-24-03-2026
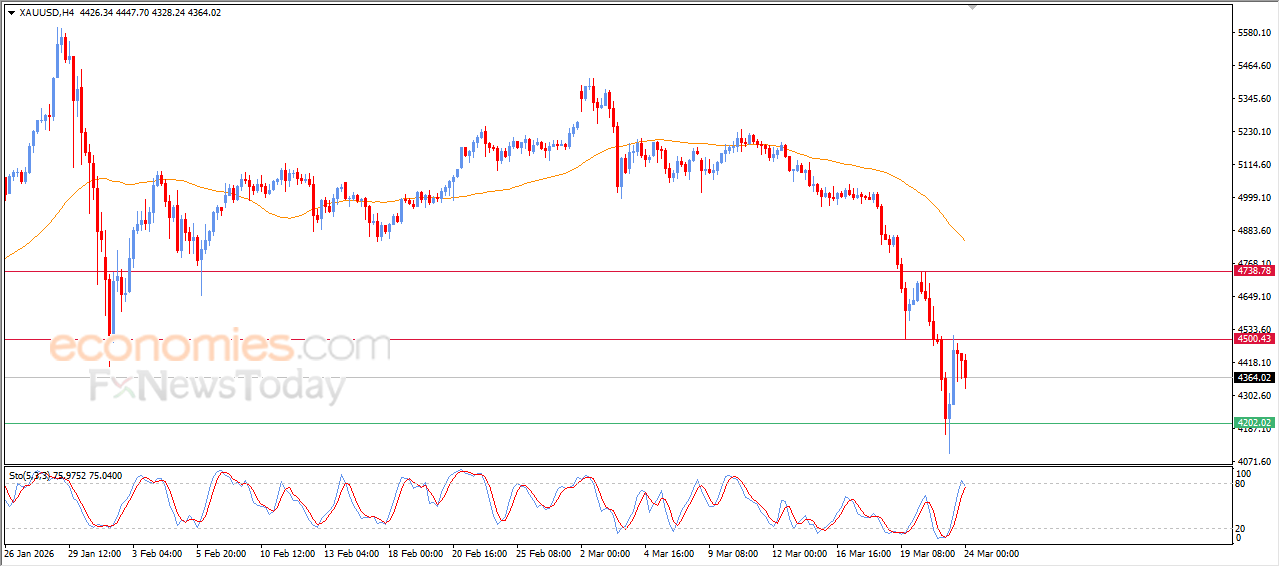
Gold prices declined in recent intraday trading, affected by the solid resistance level at $4,500, while the short-term corrective downtrend continues to dominate.
The price is also facing ongoing negative pressure as it trades below EMA50, reinforcing the bearish trend. In the background, a negative divergence is starting to form on the relative strength indicators after reaching overbought levels compared to price movement, along with the appearance of a negative crossover, increasing the likelihood of continued decline in the near term.
EURUSD price accelerates profit-taking - Analysis-24-03-2026
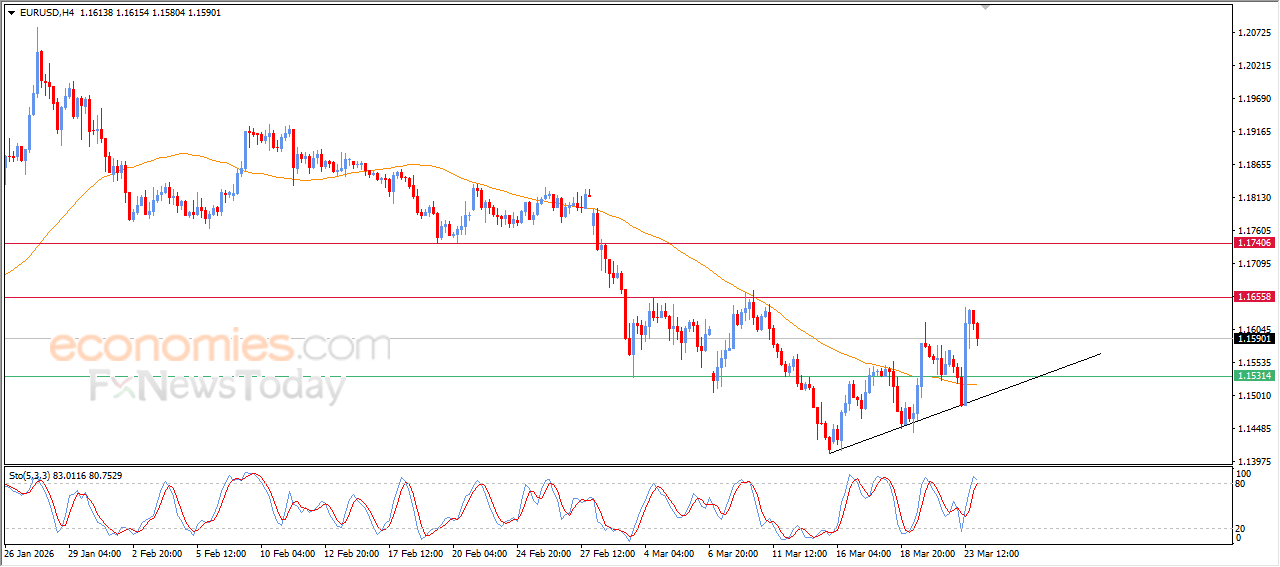
The EURUSD price declined in its recent intraday trading, in a corrective move aimed at taking profits from the strong gains recorded in yesterday’s session. This comes as an attempt to build positive momentum that could support a resumption of the upward trend in the coming period.
The pair is also trying to relieve some of the overbought conditions on the relative strength indicators, especially with the beginning of a negative crossover appearing on it. Despite this decline, the price is still benefiting from dynamic support as it trades above EMA50, which reinforces the stability of a short-term bullish corrective wave.
Evening update for Bitcoin -23-03-2026
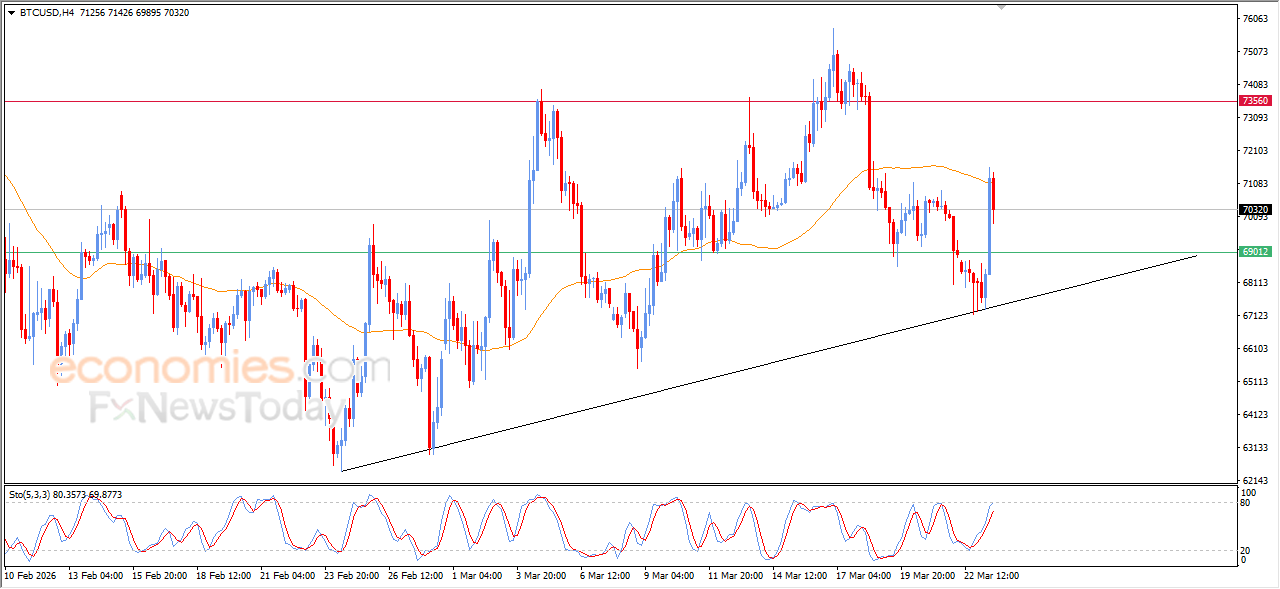
The (BTCUSD) price declined in its last intraday trading, after reaching the resistance of EMA50, to gather the gains of its rises, attempting to gain bullish momentum that might help it to get rid of the negative pressure, after drawing the line of the bullish trend, with the emergence of the positive signals from the relative strength indicators, after reaching oversold levels.
Evening update for crude oil -23-03-2026
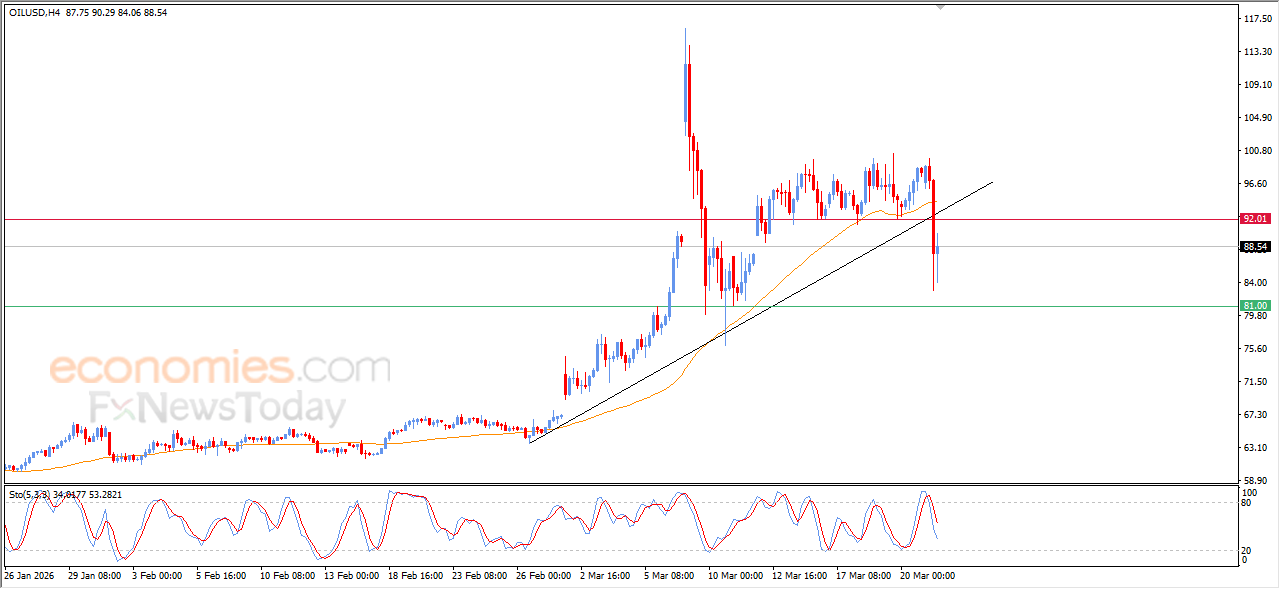
The (crude oil) price is experiencing mixed trading on its last intraday levels, attempting to recover some of its previous losses, affected by breaking main bullish trend line on short-term basis, with its trading below EMA50, which represents dynamic resistance that prevents its recovery on the near-term basis, besides the emergence of the negative signals from the relative strength indicators, after reaching overbought levels.