Gold Makes a Historic Leap Above $2,500: Did You Miss the Big Opportunity? Market Outlook Until the End of 2024!
Technical Analysis of Gold Price
The gold price resumes its long-term positive trading, beginning to test the resistance of the main ascending channel shown on the weekly chart. This indicates a potential continuation of the upward trend and further gains in the long term. Notably, confirming a break above the 2,530.00$ barrier will push the price to record new historical levels, reaching 2,600.00$ and then 2,650.00$ as the next key targets.
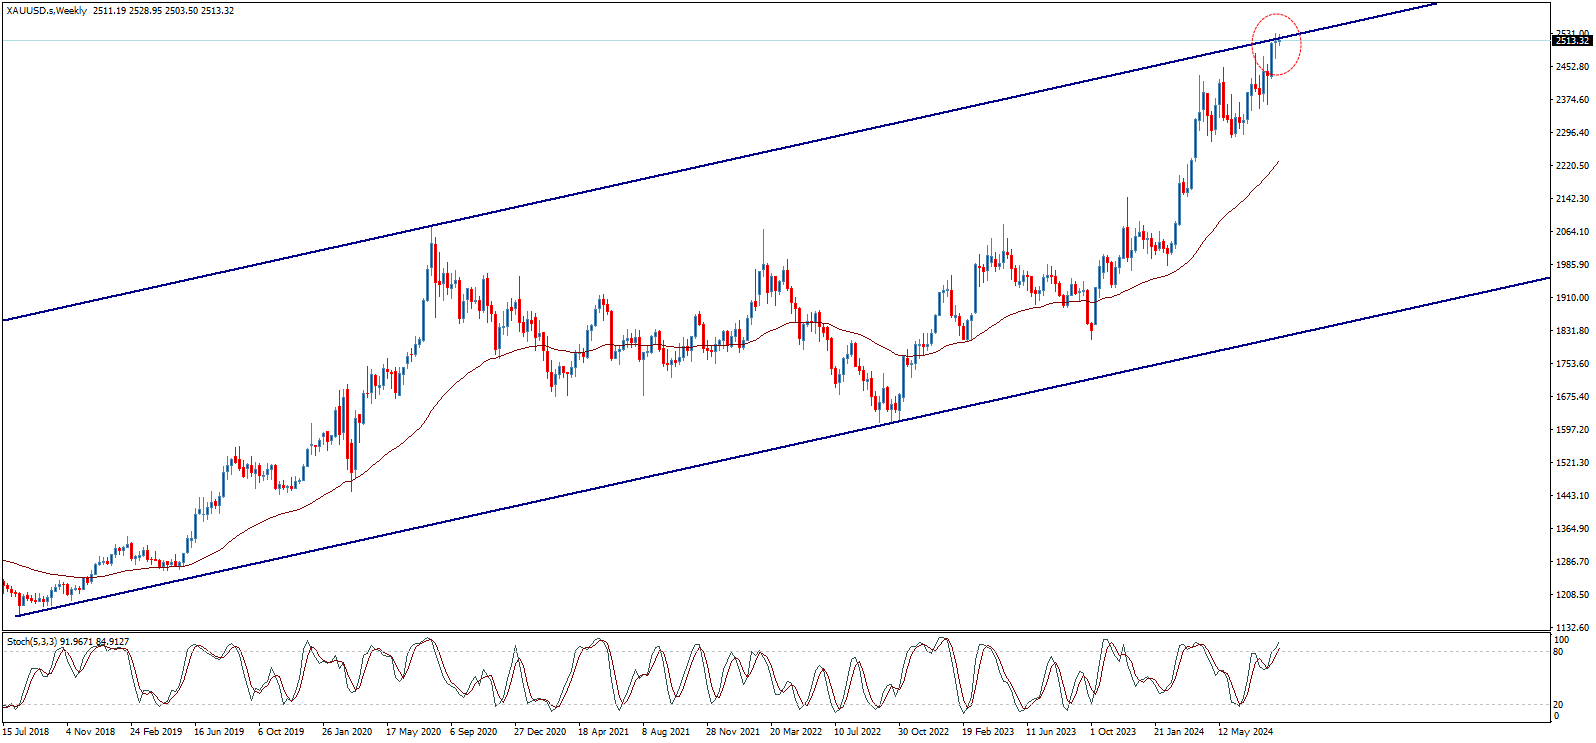
Ascending Channels Support Continuation of the Upward Wave
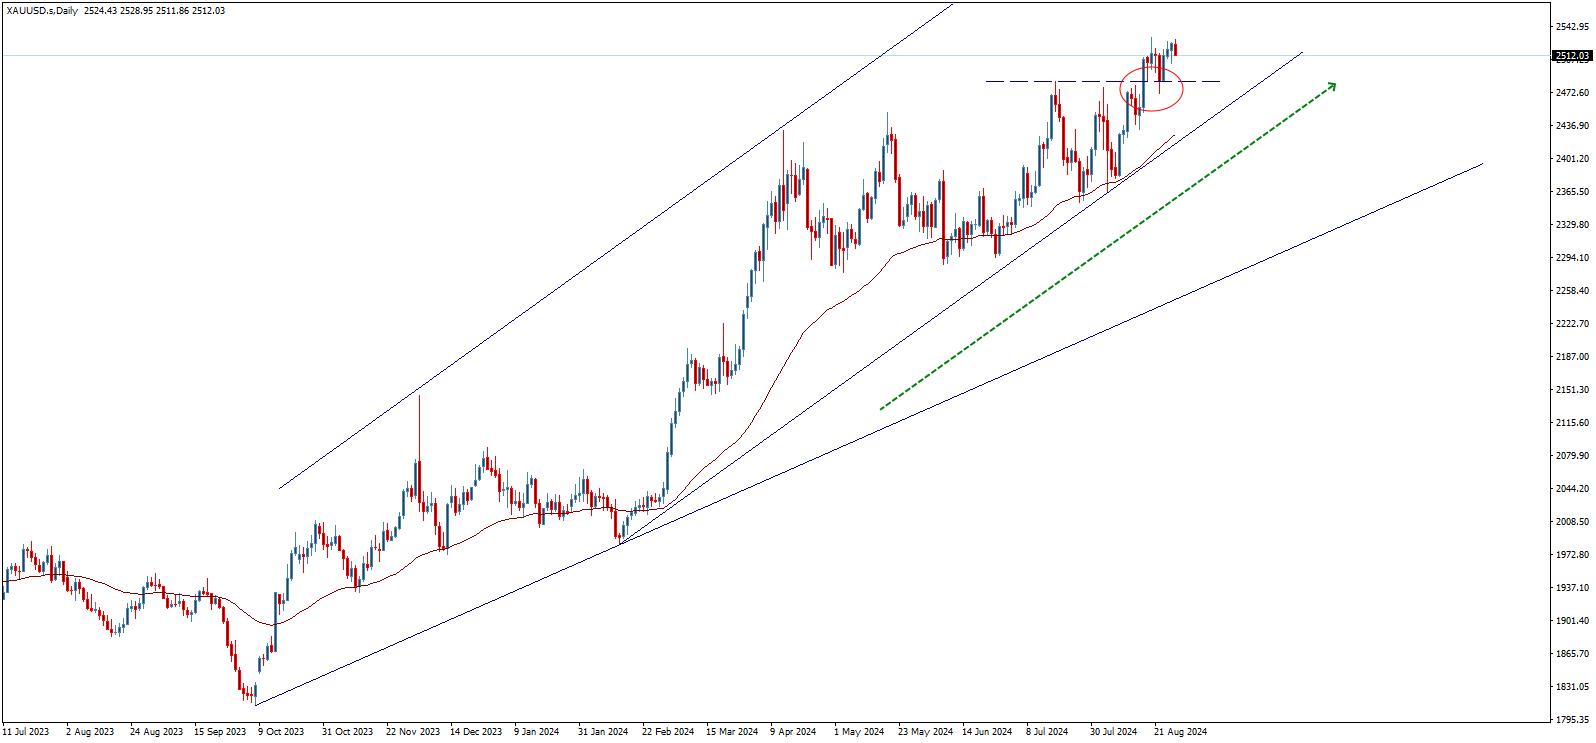
The movement within the ascending channel on the daily timeframe adds more confirmation of the chances to break the main resistance mentioned above, especially after building a support base above the 2,485.00$ level, along with the positive support provided by the 50-period moving average, enhancing the chances of continuing the upward trend in the coming period.
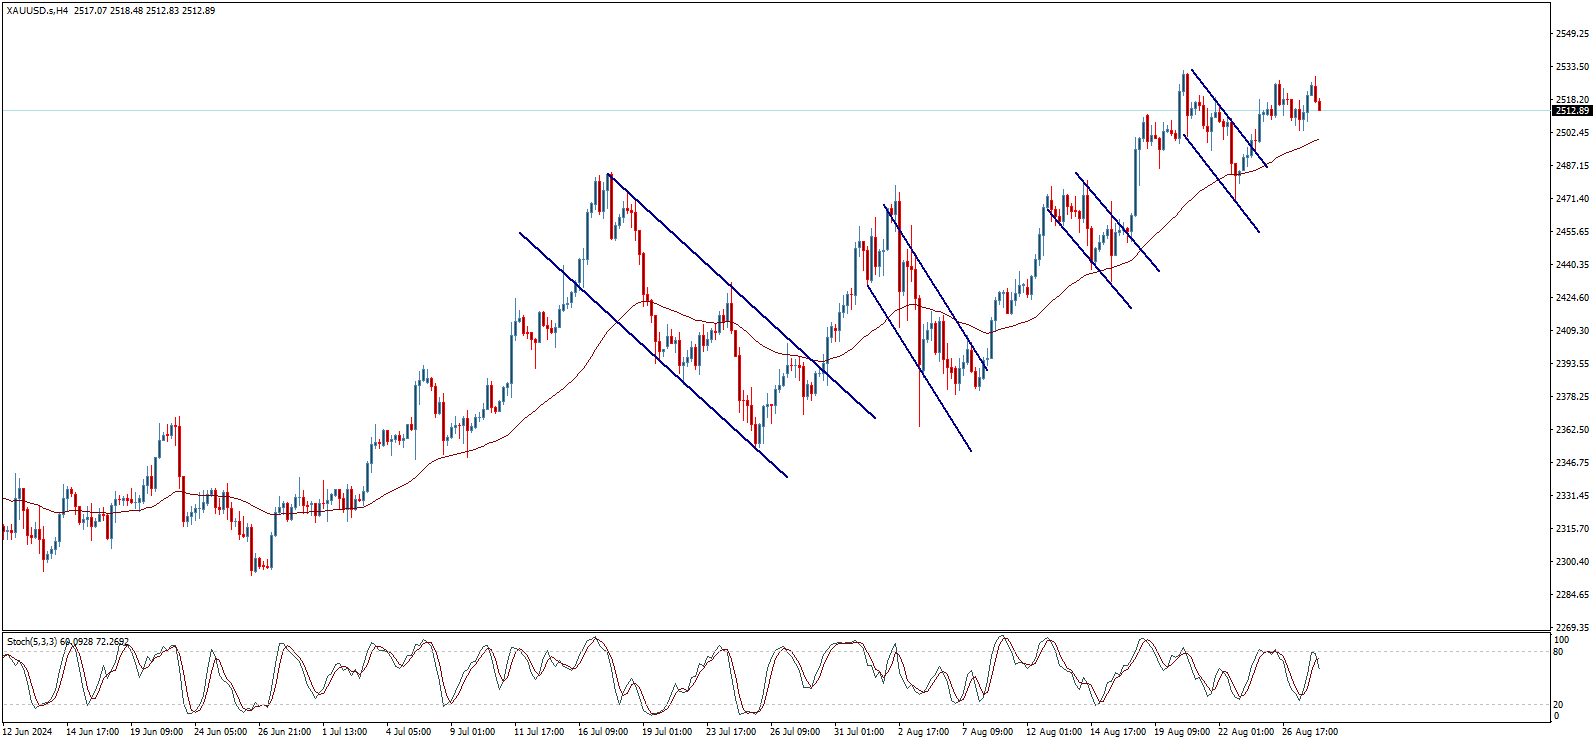
Repeated Positive Patterns
On shorter timeframes, the price continues to rise but faces temporary negative pressures followed by a continuation of the upward trend. These pressures form bullish flag patterns, as shown in the chart below, which provide motivation for the price to achieve further gains and maintain the main upward trend, adding more confirmation for achieving additional positive targets in the coming period.
Risk of Trend Reversal
Despite the previously mentioned positive factors, the price faces difficulty breaking the last peak recorded at 2,531.60$, which could lead to the formation of a double-top pattern that might cause a shift in the trend towards a decline. This pattern will be confirmed if the price attacks the 2,470.00$ level and breaks it, putting the price under negative pressure, initially targeting the 2,400.00$ area before attempting to recover again.
Summary of the Above
- The overall upward trend remains dominant and is likely to continue.
- Attention should be given to the pivotal levels that form key points for the next direction.
- The 2,530.00$ resistance level represents a confirmation of the continuation of the main upward trend, targeting 2,600.00$ and then 2,650.00$ as the next objectives.
- The 2,470.00$ support level represents the confirmation level for the negative pattern, and breaking it may lead to some downward correction before resuming the upward trend.
Best Gold Trading Platforms for 2024
XM: Trade Gold with Unmatched Confidence!
With gold prices reaching record levels, don’t miss the chance to be part of this major movement with XM, one of the most trusted and widely traded platforms in the world! XM provides you with advanced trading tools, tight spreads, and fast execution, meaning every second counts in your favor. Don’t miss the opportunity – open your account now and benefit from the big moves in the gold market!

Pepperstone: Your Golden Trading Time Starts Here!
Are you ready to seize a golden opportunity? With Pepperstone, you can easily and quickly enter the gold market! The platform offers innovative analytical tools, ultra-fast execution, and low trading costs, putting you in a prime position to take advantage of current market movements. Don’t waste your time, open your account now and be part of the action before it’s too late!

Gold Prices Surpass 2,500 Dollars per Ounce for the First Time in History: What Will the Market Performance Be Until the End of 2024?
After strenuous attempts in recent months, gold prices have finally broken through the psychological barrier of 2,500 dollars for the first time in history, achieving a new record that indicates a major shift in the precious metals market.
This increase reflects the upward market movement dominating gold prices this year, driven by several key factors that make investors turn to gold as a safe haven.
Global Easing Cycle
- Last March, the global monetary easing cycle began, with the Swiss National Bank (SNB) unexpectedly cutting its key interest rate.
- This was followed by rate cuts in Mexico, Canada, Europe, and the United Kingdom, with the Federal Reserve strongly opening the door to a US rate cut in September.
- Market experts said: In the medium term, there appears to be clear optimism for stocks, residential real estate, gold, and cryptocurrencies, thanks to the global easing cycle that will result in new liquidity injections into the markets.
US Interest Rate
- Federal Reserve Chairman Jerome Powell stated at the Jackson Hole Economic Forum: "It is time to adjust monetary policy." He added, "I am more confident that inflation is on a sustainable path to return to the 2% target."
- Following Powell's comments and according to the "Fed Watch" tool by CME Group, the probability of a 50 basis point cut in US interest rates in the September meeting rose from 25% to 38%, while the probability of a 25 basis point cut fell from 75% to 62%.
- Based on interest rate futures contracts, markets currently price in 100 basis points of US interest rate cuts before the end of this year.
- Lowering US interest rates will strongly boost demand for non-yielding assets, primarily gold, paving the way for further increases in gold bullion prices to new record levels.
Geopolitical Tensions in the Middle East
Geopolitical tensions in the Middle East continue to escalate, especially after Israel assassinated Ismail Haniyeh, the head of the Palestinian Hamas movement, in Tehran, Iran, and senior Hezbollah military commander Fuad Shukur, which could lead to a wider war than the ongoing conflict in Gaza since October 2023.
The EURCHF continues to decline – Forecast today – 28-8-2024
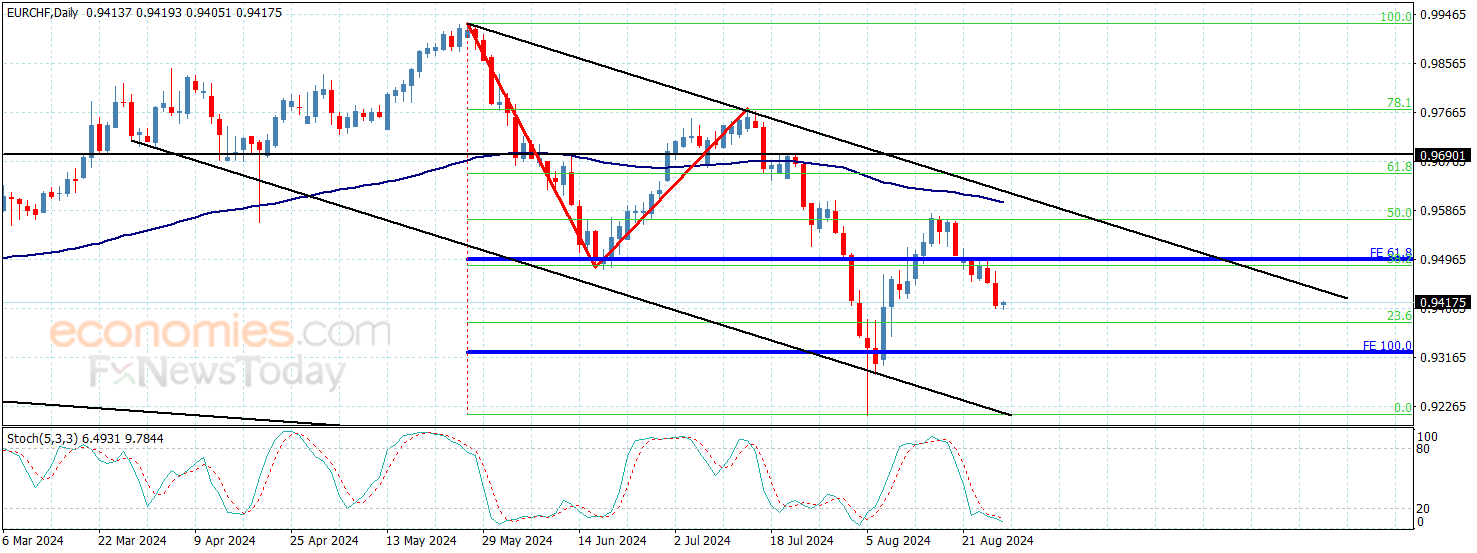
The EURCHF price confirmed its surrender to the domination of the bearish bias by fluctuating within the bearish channel in addition to 0.9495 level forming additional barrier, to notice suffering clear losses by crawling towards 0.9405, to record the first waited target.
The major indicators continue to provide the negative momentum, to increase the efficiency of the bearish track and expect moving towards 0.9375 soon, while breaking this obstacle will push the price towards 0.9325 as a next main target.
The expected trading range for today is between 0.9440 and 0.9375
Trend forecast: Bearish
Natural gas price suffers some losses – Forecast today – 28-8-2024
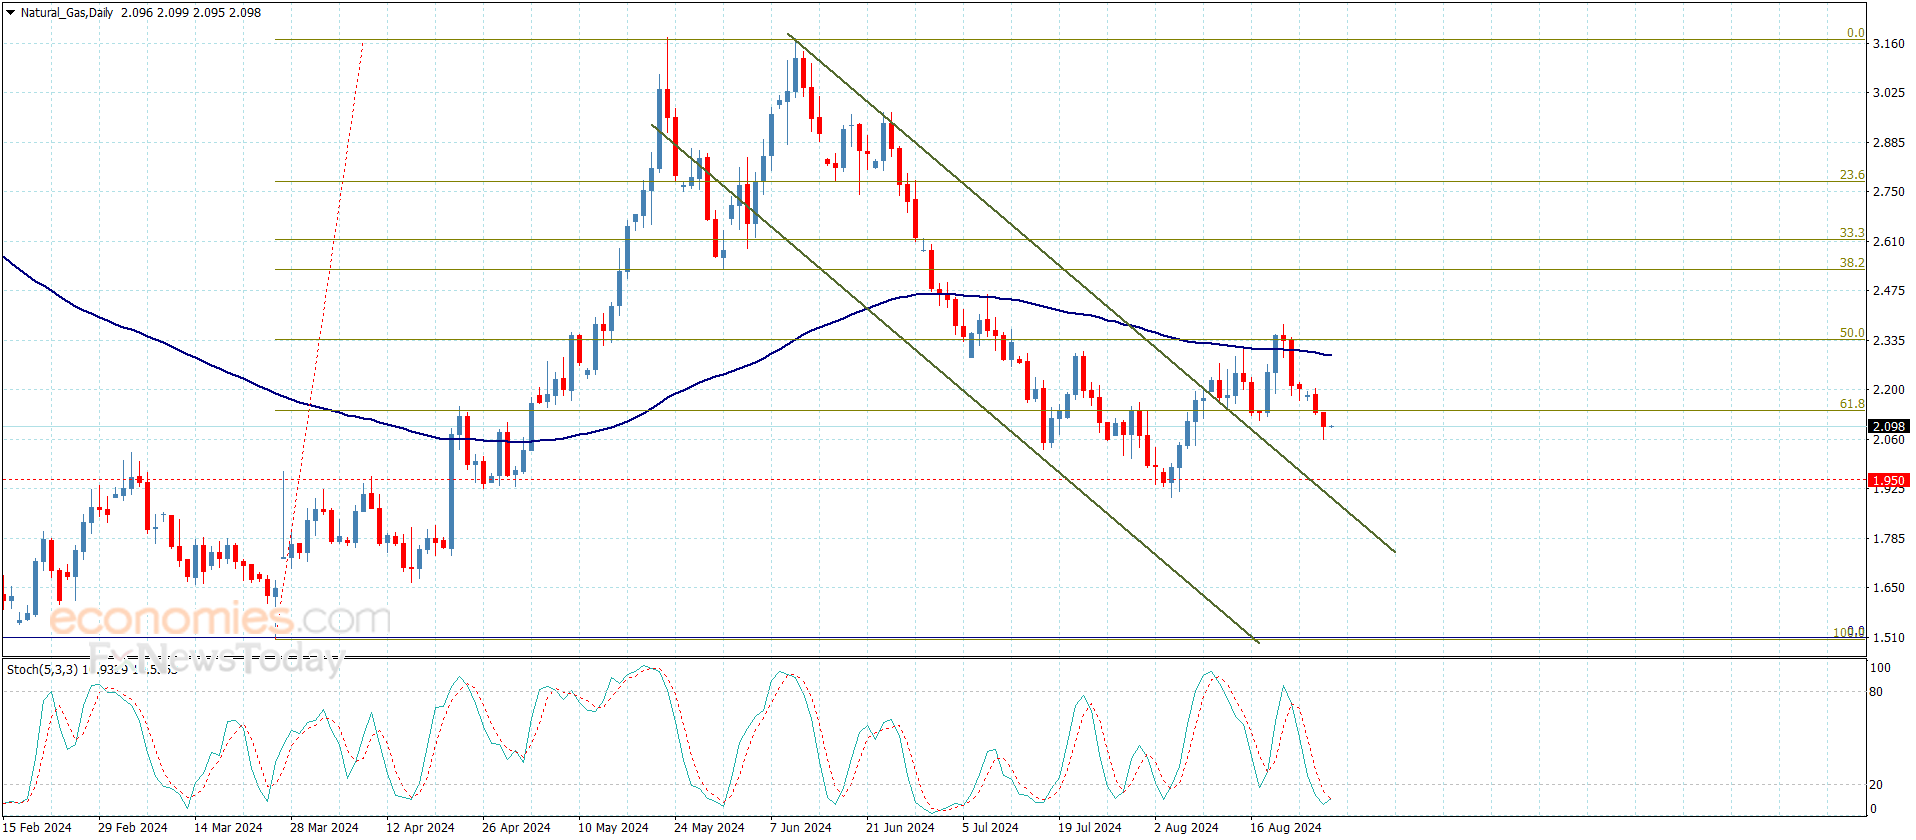
Natural gas price still affected by the negative pressures, represented by the negative momentum coming by the major indicators in addition to 2.250$ level that forms additional barrier, to notice forming new negative wave yesterday and suffer some losses by touching 2.060$.
We expect to renew the negative attempts in order to reach the main stations near 1.950$ followed by reaching the next support at 1.870$.
The expected trading range for today is between 1.950$ and 2.160$
Trend forecast: Bearish
The EURJPY begins the negative crawl – Forecast today – 28-8-2024
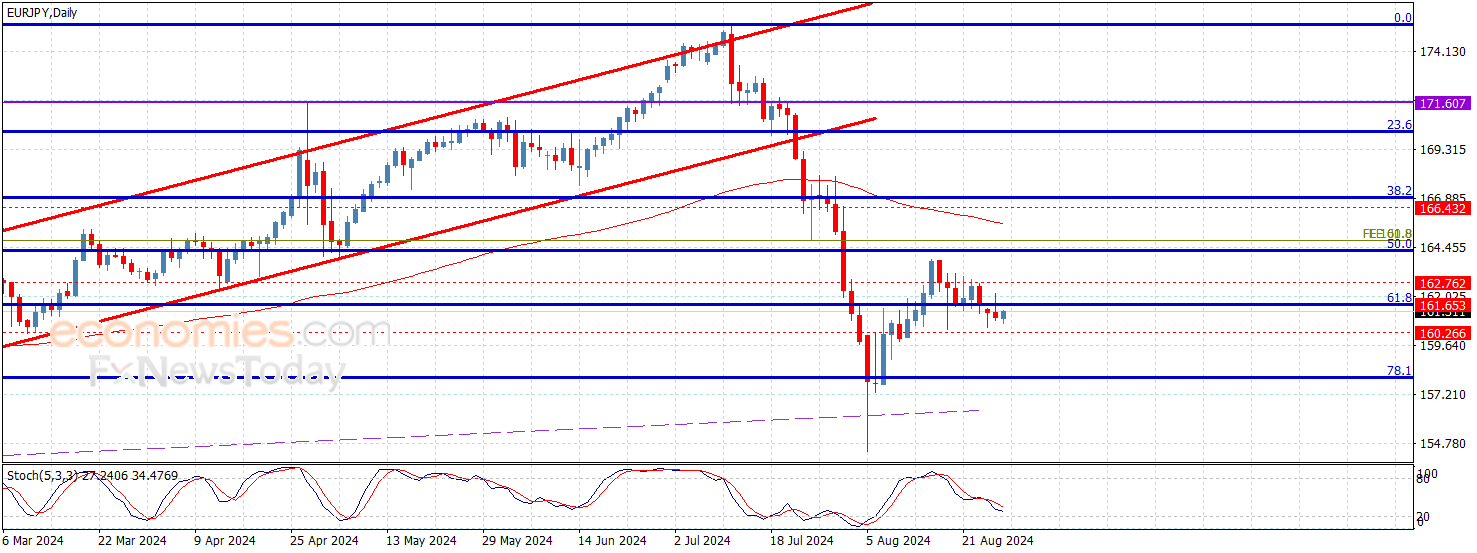
The EURJPY pair ended yesterday by providing new negative close below 161.60 barrier, confirming its surrender to the domination of the previously suggested bearish bias, to notice targeting 160.70 recently.
Stochastic approach to 20 level will increase the chances of gathering the required additional negative momentum to attack 160.25, while breaking this obstacle will push the price to start targeting new negative stations by crawling towards 159.80 and 159.00.
The expected trading range for today is between 161.80 and 159.80
Trend forecast: Bearish