Forecast update for gold -30-09-2025.
AI Summary
- Gold price slipped lower in last intraday trading, attempting to offload overbought conditions and gathering positive strength for a potential bullish track.
- VIP Trading Signals Performance by BestTradingSignal.com offers high-accuracy signals for US stocks, crypto, forex, and VIP signals for gold, oil, forex, bitcoin, ethereum, and indices.
- Subscription packages range from €44/month for US Stock Signals to €179/month for VIP Signals, with performance reports available for September 22-26, 2025.
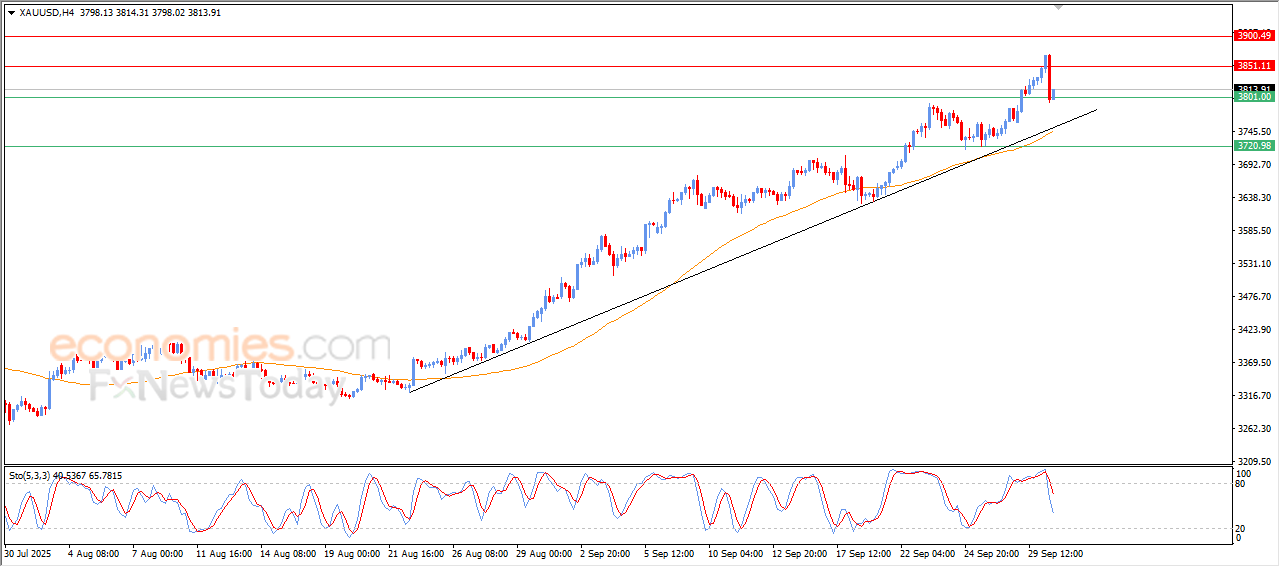
The price of (gold) slipped lower in its last intraday trading, to gather the gains of its previous rises, attempting to offload its overbought conditions on the relative strength indicators, with the emergence of the negative signals from there, gathering its positive strength that might turn to the bullish track after sequence gains, amid the dominance of the main bullish trend on the short-term basis and its trading alongside trend line, with the continuation of the positive pressure that comes from its trading above EMA5, reinforcing the chances of its recovery if it kept the stability of the current resistance.
VIP Trading Signals Performance by BestTradingSignal.com (September 22–26, 2025)
Get high-accuracy trading signals delivered directly to your Telegram. Subscribe to specialized packages tailored for the world’s top markets:
US Stock Signals from €44/month
Subscribe via TelegramCrypto Signals from €49/month
Subscribe via TelegramForex Signals from €49/month
Subscribe via TelegramVIP Signals (Gold, Oil, Forex, Bitcoin, Ethereum, Indices) from €179/month
Subscribe via TelegramFull VIP signals performance report for September 22–26, 2025:
Forecast update for EURUSD -30-09-2025.
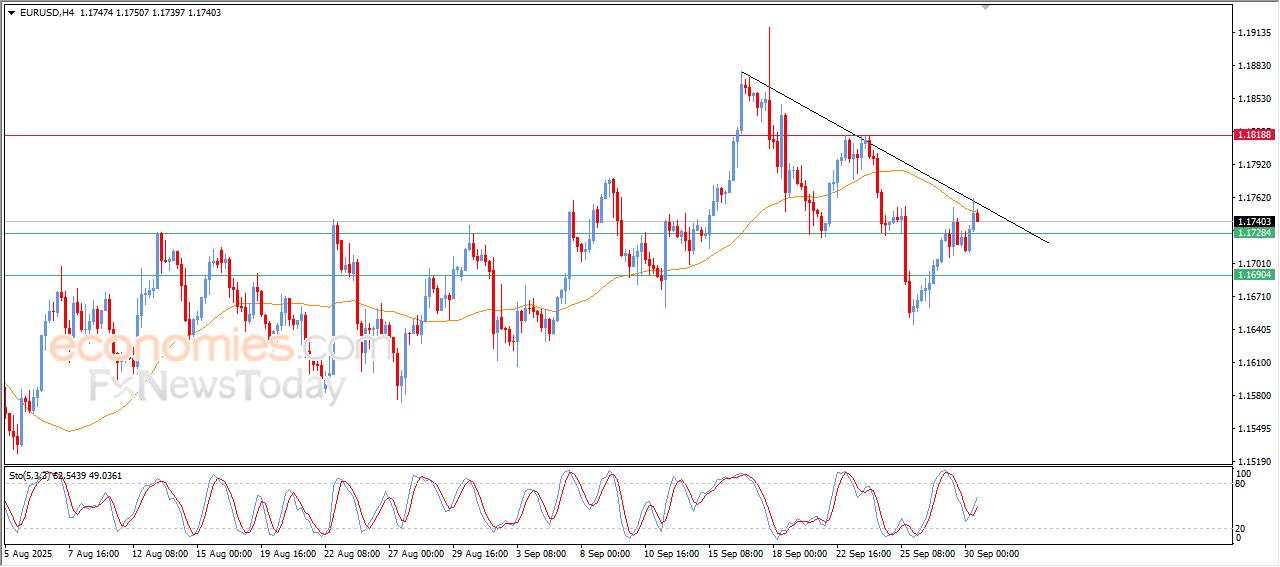
The price of (EURUSD) settled high in its last intraday trading, attempting to get rid of its negative pressure, where it reached bearish correction trend line on the short-term basis, attempting to surpass the resistance of its EMA50, to indicate extending the upcoming gains for the price, with the emergence of the positive signals on the relative strength indicators, after offloading the overbought condition, opening the way for achieving more of the gains on the near-term basis.
VIP Trading Signals Performance by BestTradingSignal.com (September 22–26, 2025)
Get high-accuracy trading signals delivered directly to your Telegram. Subscribe to specialized packages tailored for the world’s top markets:
US Stock Signals from €44/month
Subscribe via TelegramCrypto Signals from €49/month
Subscribe via TelegramForex Signals from €49/month
Subscribe via TelegramVIP Signals (Gold, Oil, Forex, Bitcoin, Ethereum, Indices) from €179/month
Subscribe via TelegramFull VIP signals performance report for September 22–26, 2025:
The GBPAUD is maneuvering the support– Forecast today – 30-9-2025
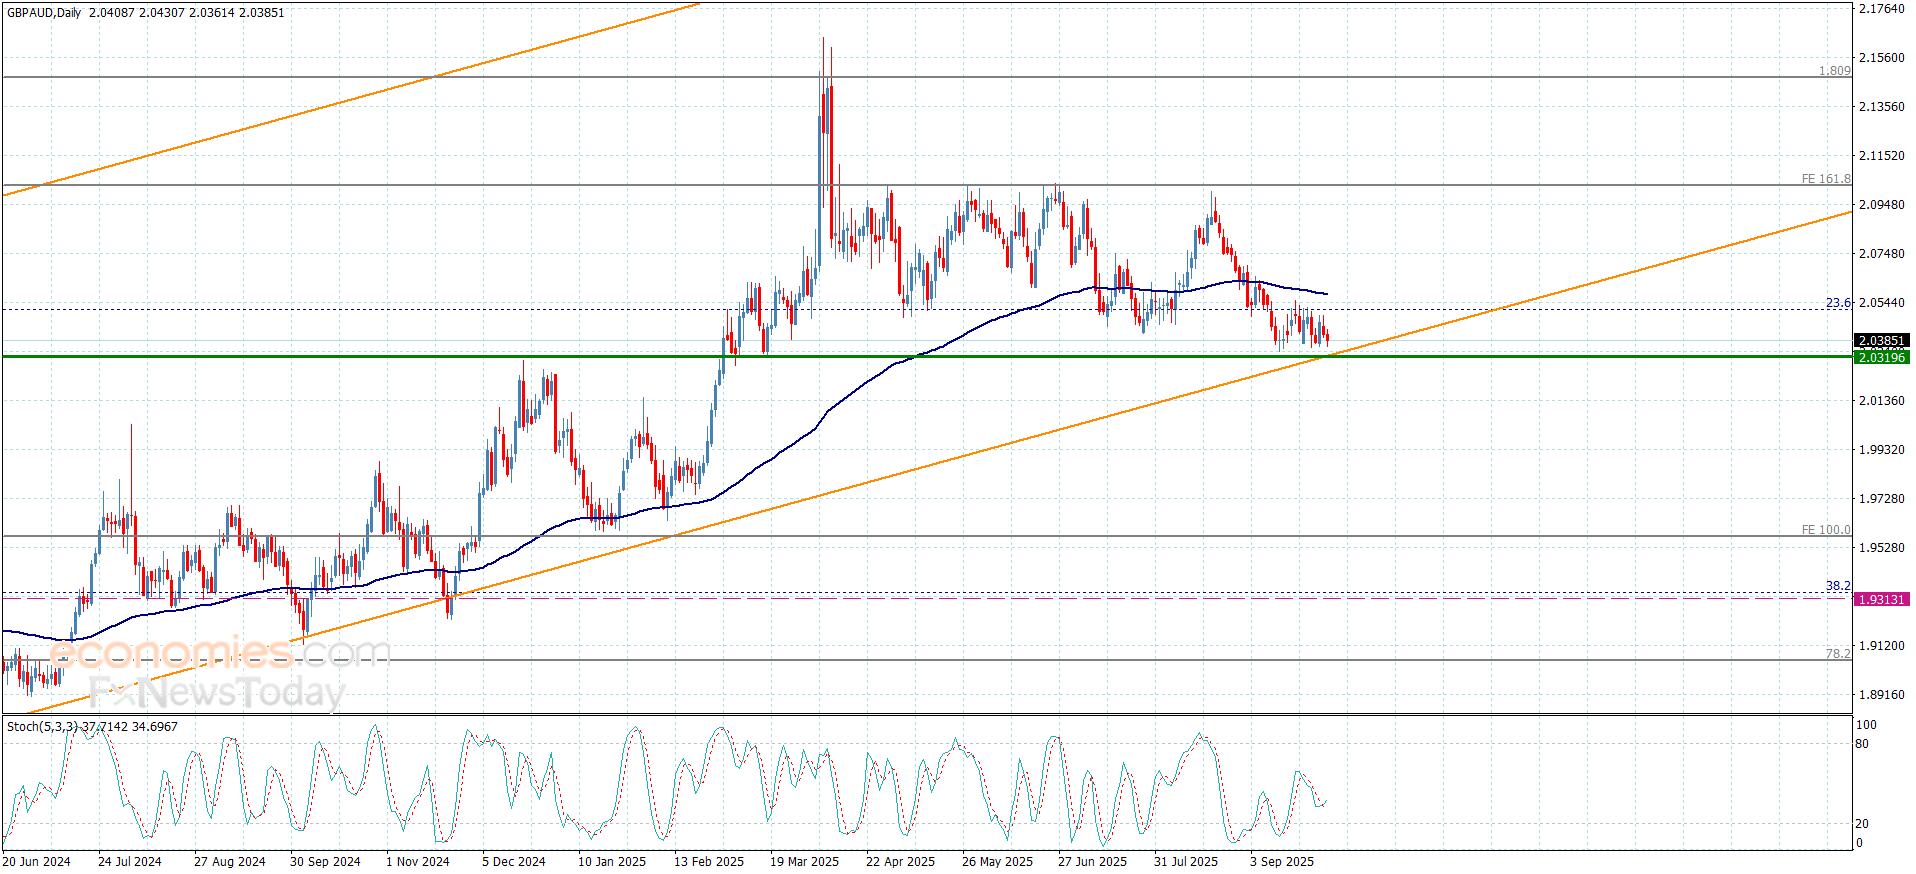
The GBPAUD returned to activate with the main indicators, which forces it to attack the critical support at 2.0315 and holding above it, noticing stochastic attempt to provide extra positive momentum, to provide new chance for activating the bullish track, to expect its rally towards 2.0450 initially, then surpassing 23.6%Fibonacci correction level at 2.0510, to confirm its readiness to form strong bullish waves in the upcoming period.
While the price decline below the current support and providing negative close will confirm its move to the negative track, which forces it to suffer several losses by reaching 2.0220 and 2.0075.
The expected trading range for today is between 2.0315 and 2.0410
Trend forecast: Bullish
Natural gas price repeats the pressure on the resistance– Forecast today – 30-9-2025
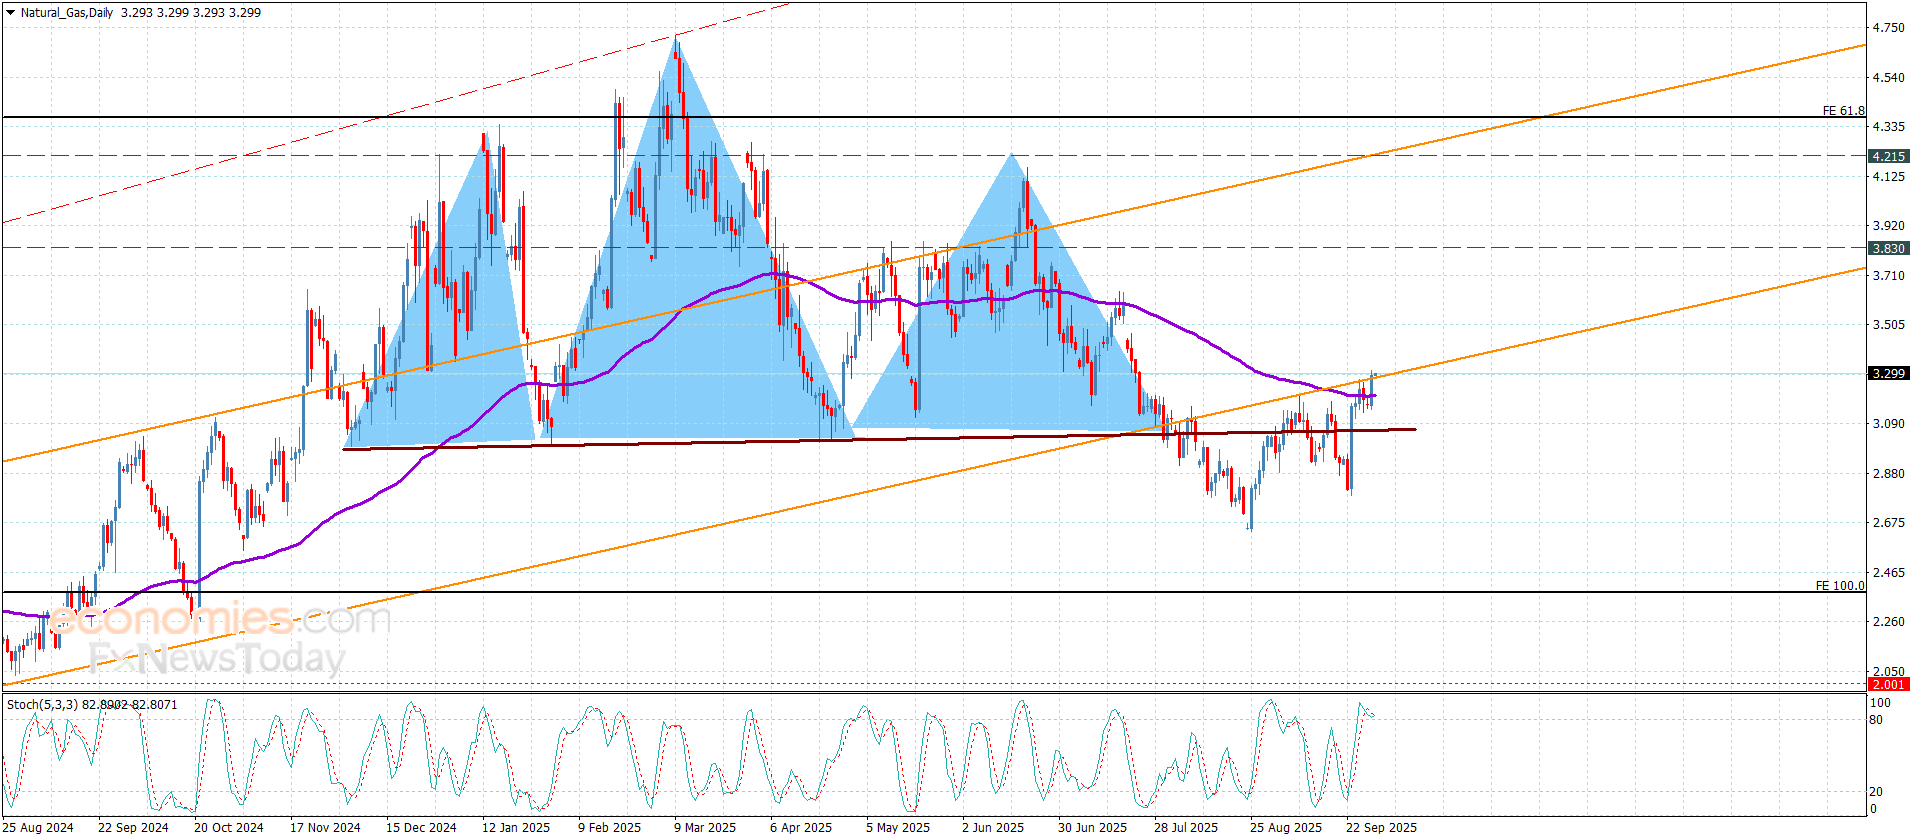
Natural gas price took advantage of its stability above $3.060 level, to form new bullish waves, surpassing the moving average 55, repeating the pressure on the critical resistance at $3.280 level currently.
Note that the continuation of providing positive momentum by the main indicators might assist breaching the resistance to confirm regaining the bullish track by its stability within the bullish stations that begin at $3.410 and $3.530.
The expected trading range for today is between $3.190 and $3.410
Trend forecast: Bullish