Forecast update for gold -22-10-2025.
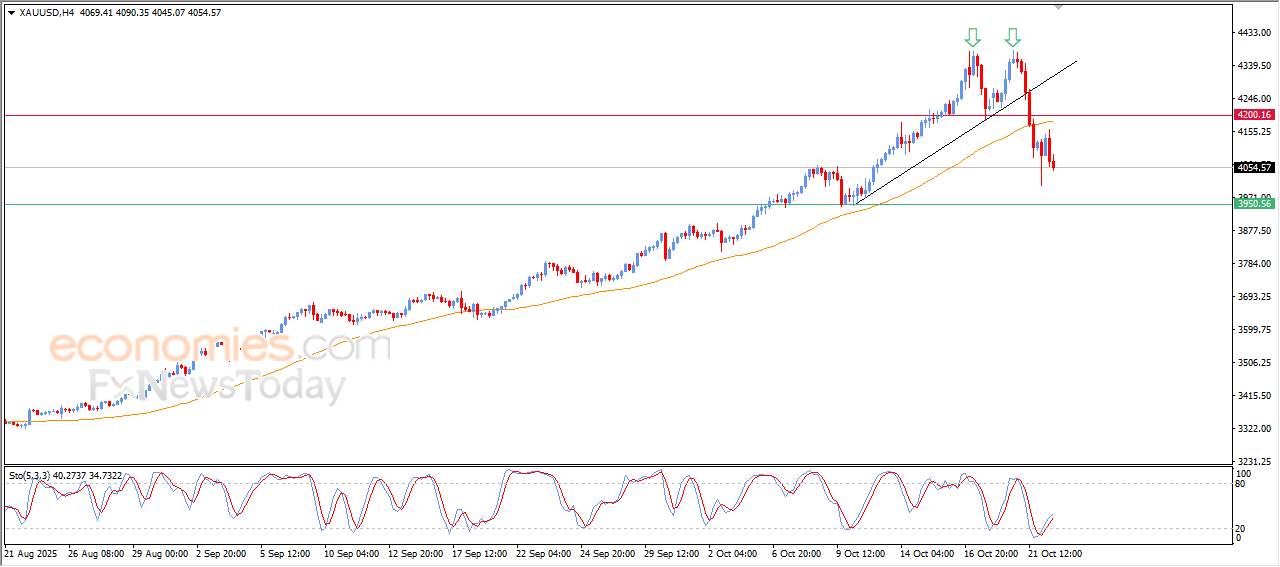
The price of (gold) declined in its last intraday trading, amid the dominance of steep bearish wave with the effect of the short-term negative technical formation that is represented by the double top pattern, with the continuation of its trading below EMA50, forming dynamic resistance to reduce the chances of the price recovery on the near-term basis, after offloading the oversold conditions on the relative strength indicators.
VIP Trading Signals Performance by BestTradingSignal.com (13-17 Oct, 2025)
Get high-accuracy trading signals delivered directly to your Telegram. Subscribe to specialized packages tailored for the world’s top markets:
US Stock Signals from €44/month
Subscribe via TelegramCrypto Signals from €49/month
Subscribe via TelegramForex Signals from €49/month
Subscribe via TelegramVIP Signals (Gold, Oil, Forex, Bitcoin, Ethereum, Indices) from €179/month
Subscribe via TelegramFull VIP signals performance report for 13-17, October 2025:
View Full Performance Report Telegram (https://t.me/besttradingsignalstocksbot?start=p88d632b0-66dd-11f0-a948-13815052d5ae)
Forecast update for EURUSD -22-10-2025.
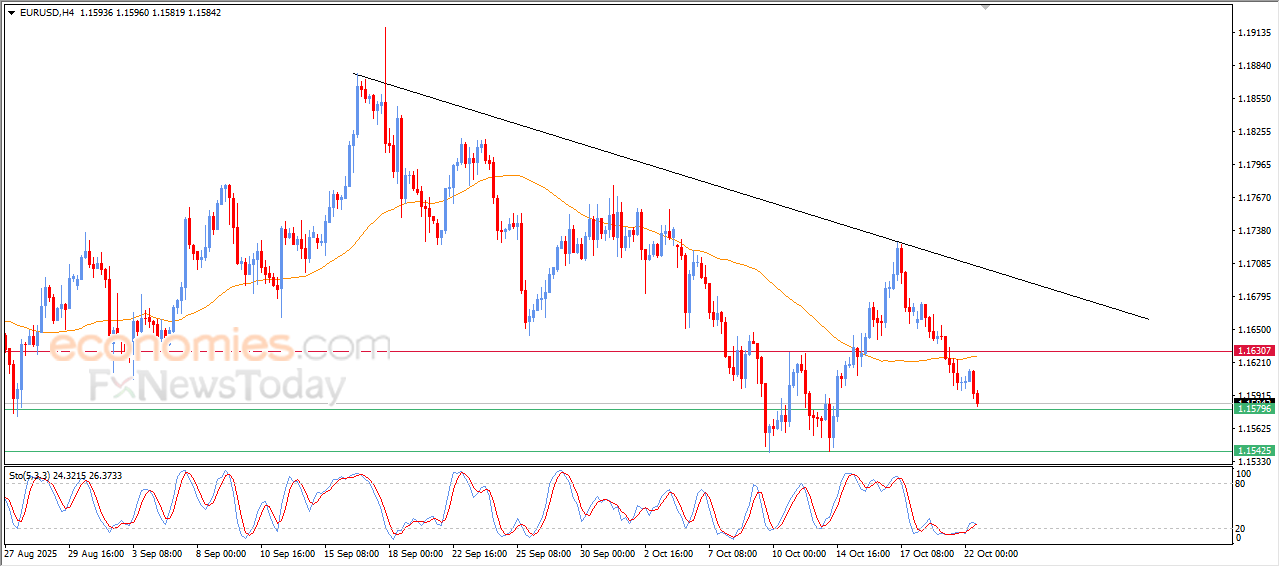
The price of (EURUSD) declined in its last intraday trading, amid the continuation of the pressure of its trading below EMA50, and under the dominance of the main bearish trend on the short-term basis and its trading alongside trendline, besides the emergence of negative crossover on the relative strength indicators, after offloading some of the oversold conditions, reinforcing the possibilities for extending the losses in the upcoming trading.
VIP Trading Signals Performance by BestTradingSignal.com (13-17 Oct, 2025)
Get high-accuracy trading signals delivered directly to your Telegram. Subscribe to specialized packages tailored for the world’s top markets:
US Stock Signals from €44/month
Subscribe via TelegramCrypto Signals from €49/month
Subscribe via TelegramForex Signals from €49/month
Subscribe via TelegramVIP Signals (Gold, Oil, Forex, Bitcoin, Ethereum, Indices) from €179/month
Subscribe via TelegramFull VIP signals performance report for 13-17, October 2025:
View Full Performance Report Telegram (https://t.me/besttradingsignalstocksbot?start=p88d632b0-66dd-11f0-a948-13815052d5ae)
The CADJPY renews the bullish action – Forecast today – 22-10-2025
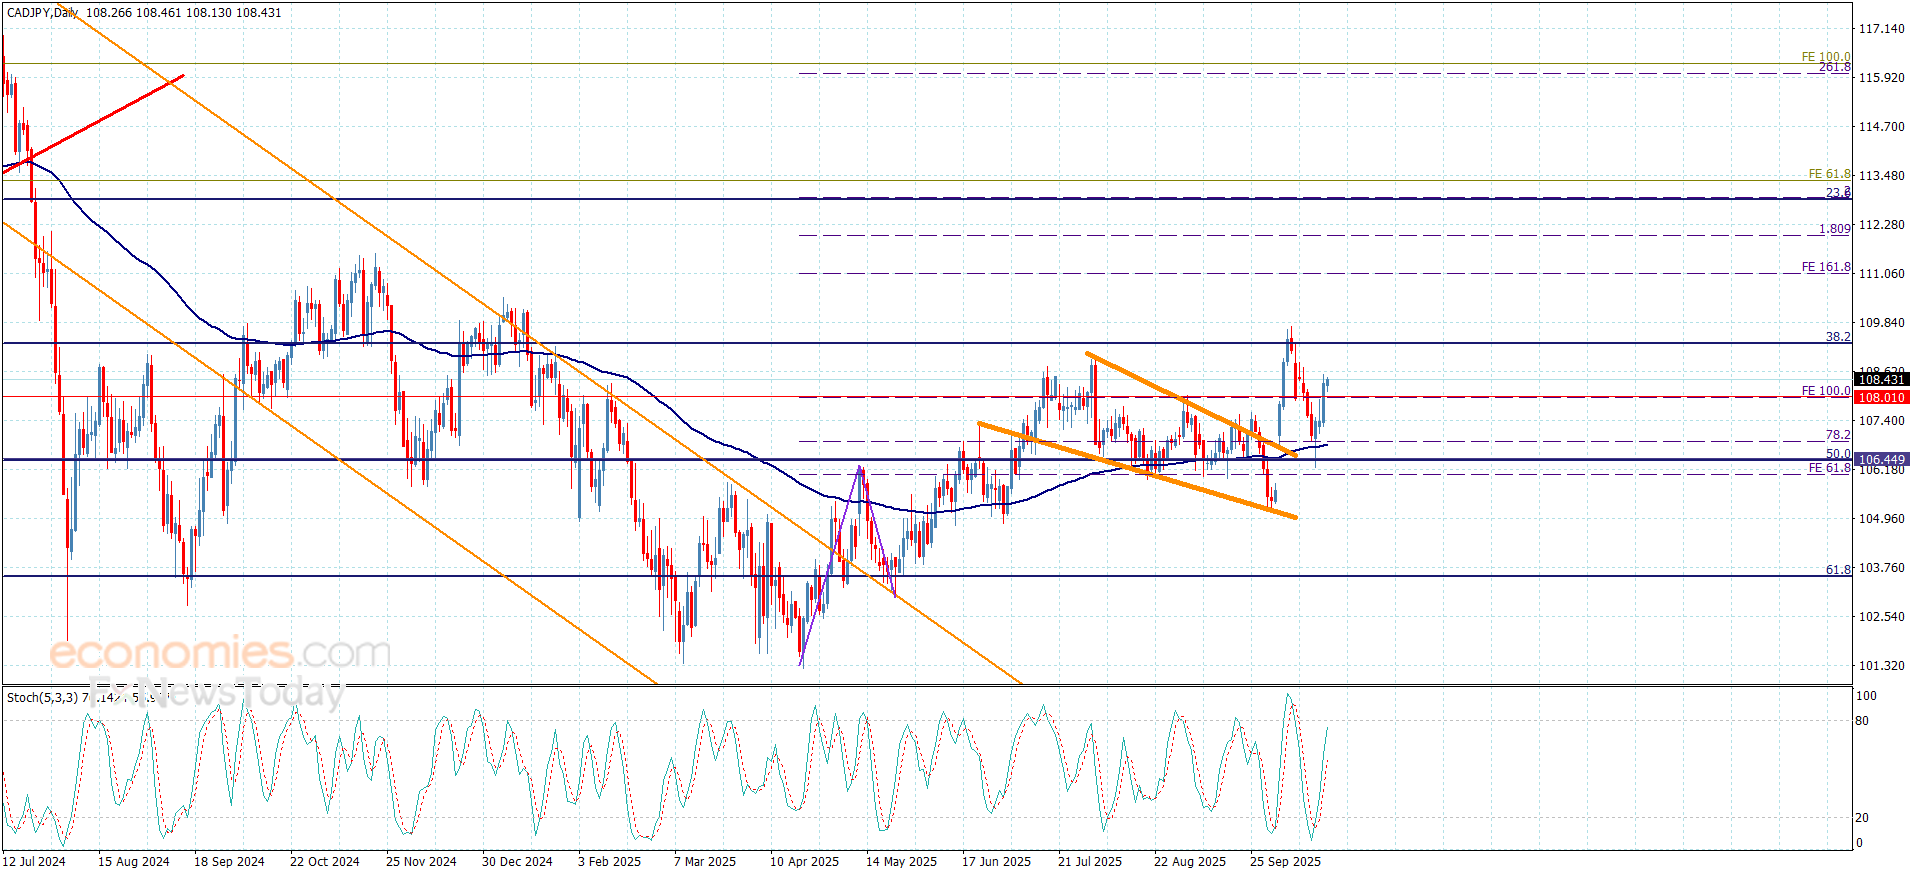
The CADJPY ended the bearish corrective rebound by testing the support of 106.45, then begin activating with the main indicators positivity by recording some gains by its rally towards 108.60, to settle above 100%Fibonacci extension level at 108.00.
And that confirms the continuation of the bullish trading, to expect providing positive momentum by the main indicators to target 109.10 level, attempting to press on the barrier near 109.40 to find an exit for recording gains in the upcoming period.
The expected trading range for today is between 0.7425 and 0.7465
Trend forecast: Bullish
Natural gas price keeps rising– Forecast today – 22-10-2025
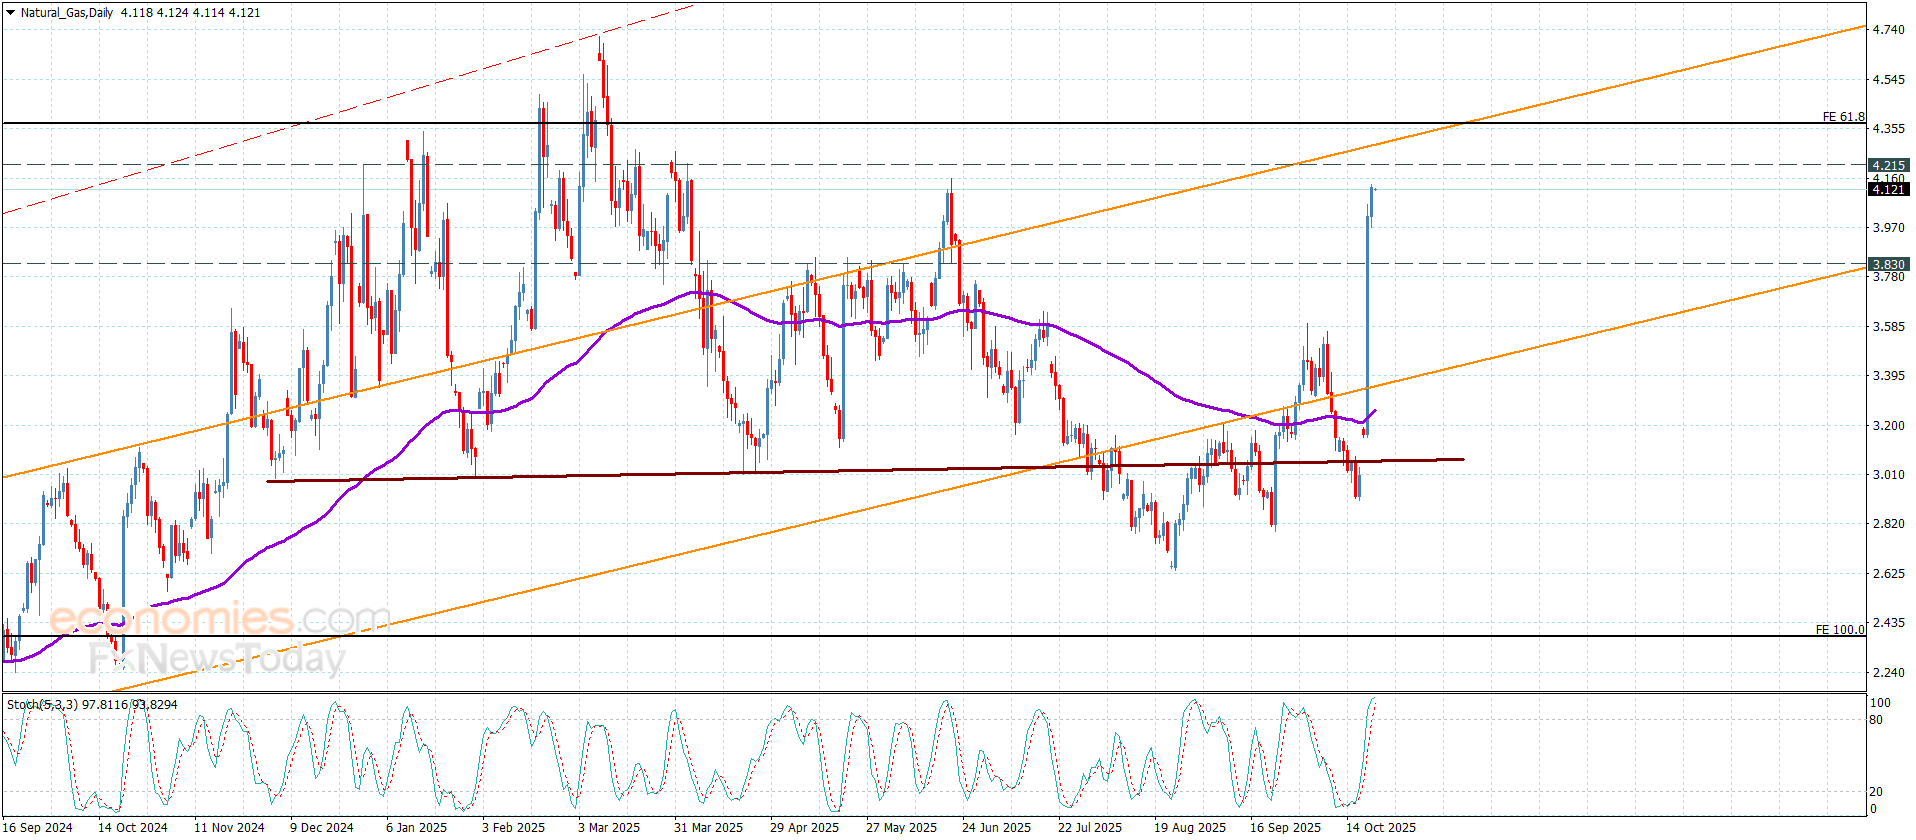
Natural gas price took advantage of its stability within the bullish channel’s levels besides forming an extra support at $3.830 level, resuming the bullish attack and its stability near the initial extra target at $4.150.
No escape from forming more of the bullish trading, attempting to press on the barrier at $4.210, then attempts to reach the resistance of the bullish channel towards $4.290, to form the main target of the current trading.
The expected trading range for today is between $4.050 and $4.290
Trend forecast: Bullish