Forecast update for gold -15-05-2026.
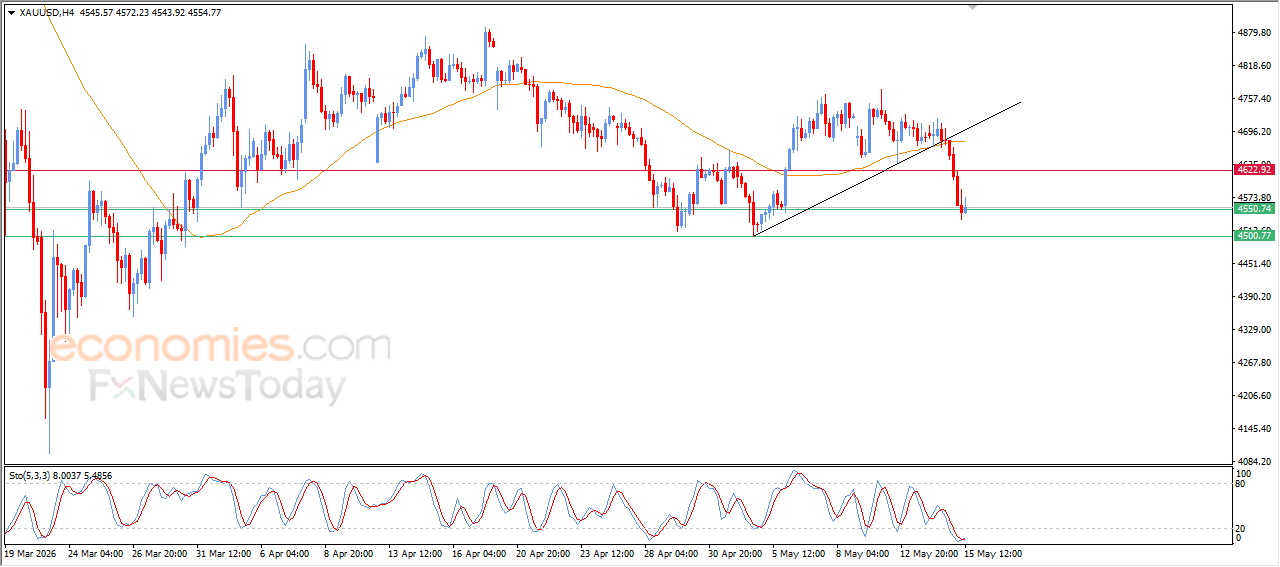
Gold price settles with series of losses in its last trading, reaching $4,550 support, which was an expected target in our last analysis, amid the dominance of the bearish corrective trend on the short-term basis, with the continuation of the negative pressure due to its trading below EMA50, reducing the chances of sustainable recovery on near-term basis, however we notice the emergence of positive crossover on the relative strength indicators, after reaching oversold levels, which might reduce the upcoming losses due to its neediness to offload some of these oversold conditions.
Forecast update for EURUSD -15-05-2026.
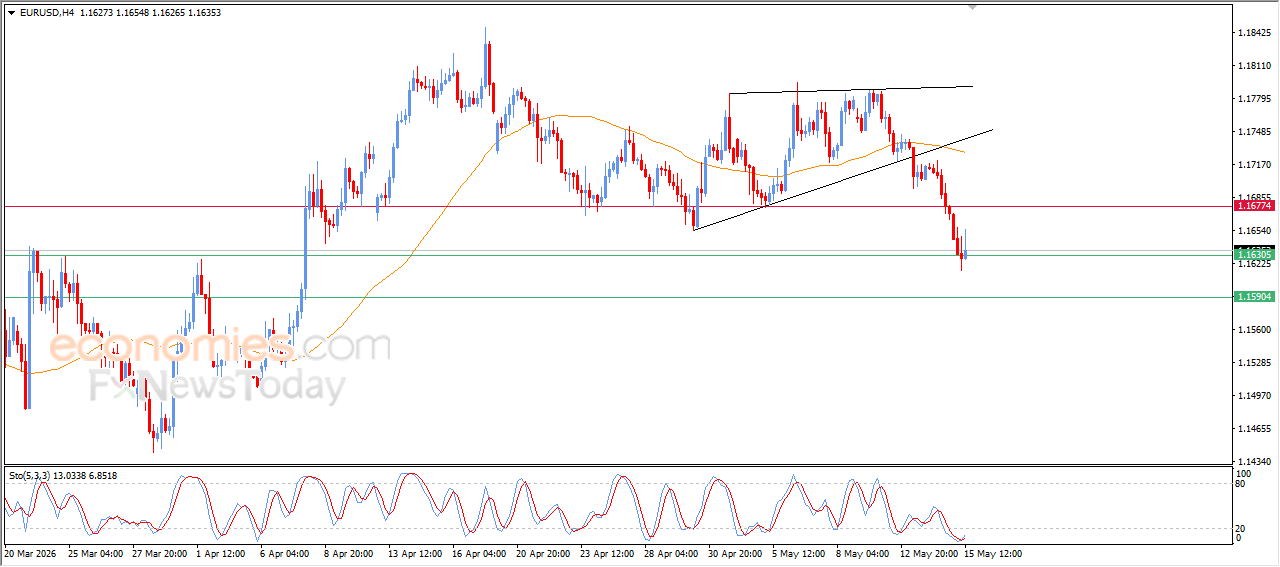
The EURUSD rose during its latest intraday trading, following the stability of the 1.1630 support level, which was our target in the morning analysis. This support provided the pair with some positive momentum, helping it recovers part of its previous losses. At the same time, the pair is attempting to ease its clearly oversold conditions shown by the relative strength indicators, especially with the beginning of a positive crossover signal.
However, the short-term corrective bearish trend still dominates, while negative pressure continues as the pair trades below EMA50, which increases the bearish pressure.
The CHFJPY faces strong barrier– Forecast today – 15-5-2026
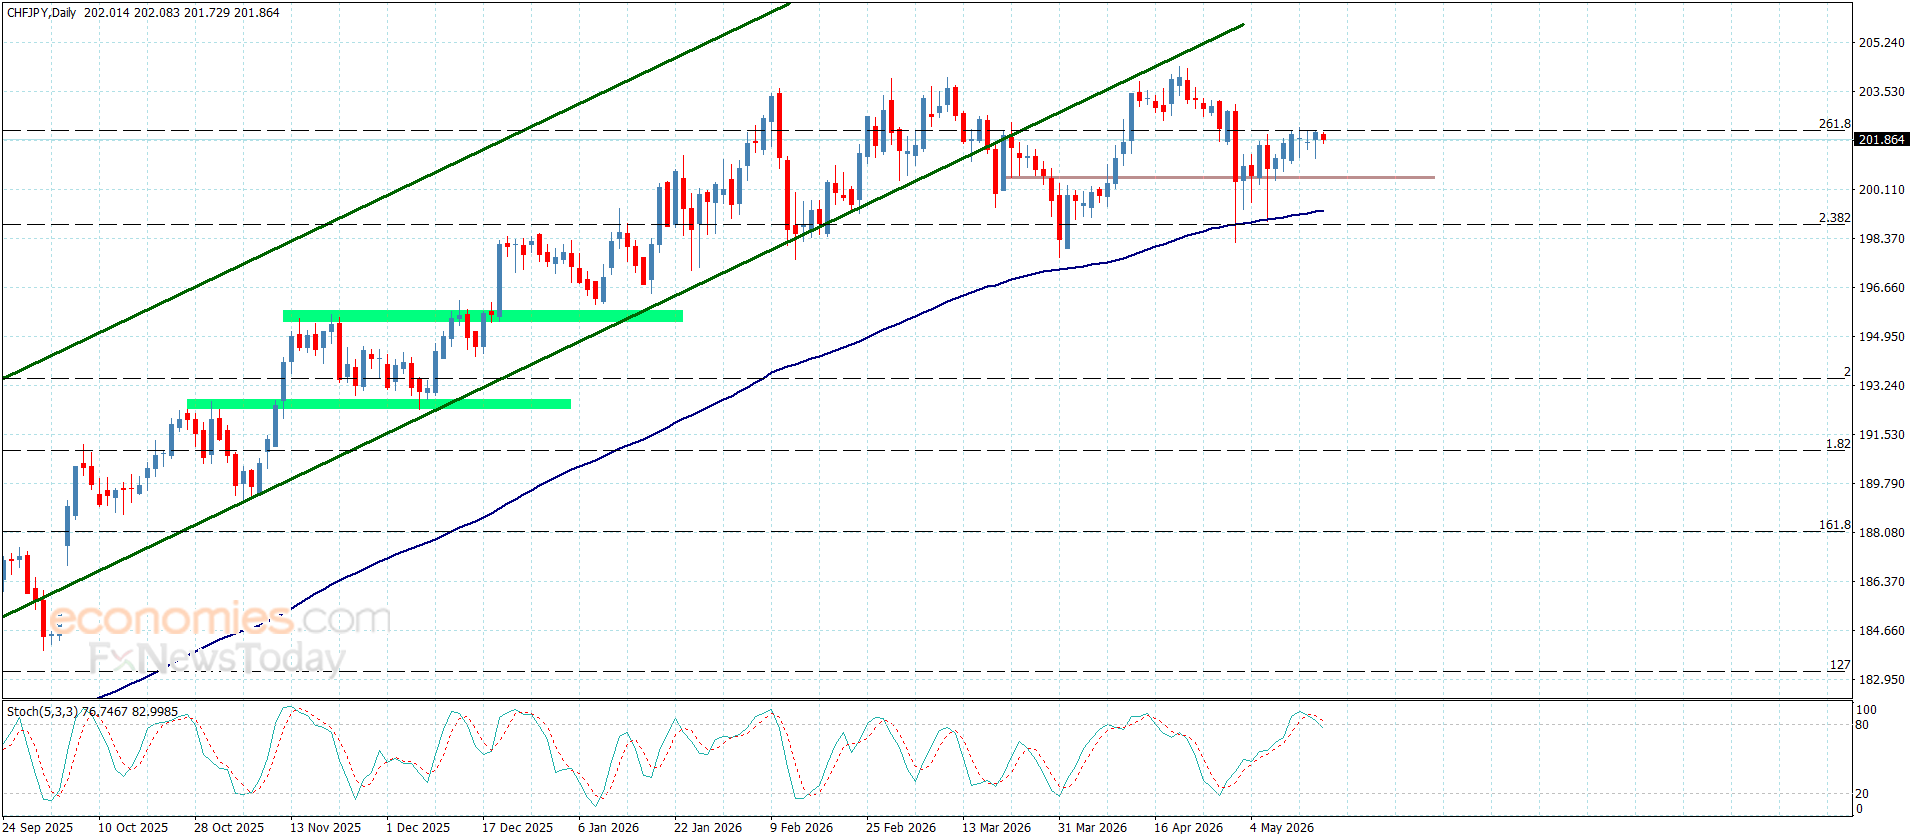
The pair has formed several bullish waves in recent trading, testing the 261.8% Fibonacci extension level, which acts as an important resistance at 202.20. This has forced the price into a negative pullback, stabilizing around 201.75.
If the price remains below this current resistance, and with the stochastic indicator showing negative momentum, stronger bearish waves may begin to form, targeting 201.10 initially, followed by renewed pressure on the support at 200.50.
However, a breakout above the resistance and sustained trading above it would give the price an opportunity to record additional gains, first toward 202.60 and then extending to 203.20.
The expected trading range for today is between 201.10 and 212.20
Trend forecast: Bearish
The EURJPY reaches the initial target– Forecast today – 15-5-2026
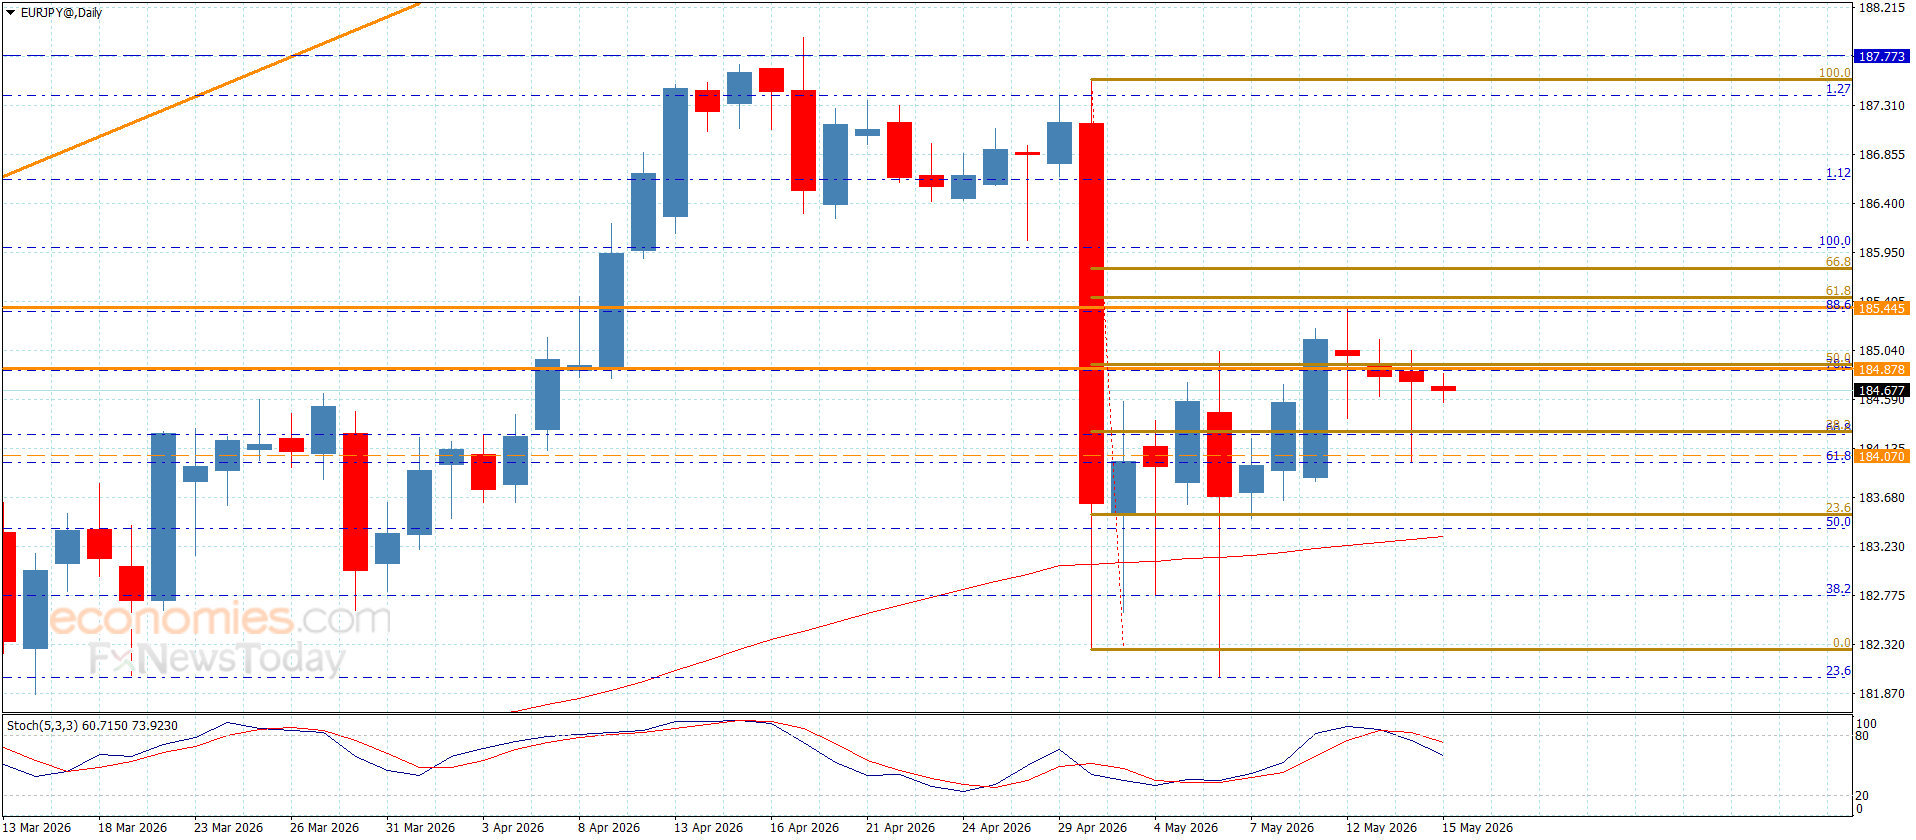
The EURJPY pair formed a new bearish wave during yesterday’s trading, reaching the first target at 184.10, where it encountered the 61.8% Fibonacci retracement level before quickly rebounding toward 184.80, as shown on the attached chart.
We reiterate that the bearish scenario remains valid as long as the main resistance at 185.50 holds. Therefore, we continue to wait for additional negative momentum accumulation, which could enable a break below 184.10 and open the way toward new downside targets at 183.50 and 182.75.
The expected trading range for today is between 183.50 and 185.00
Trend forecast: Bearish