Forecast update for gold -09-10-2025.
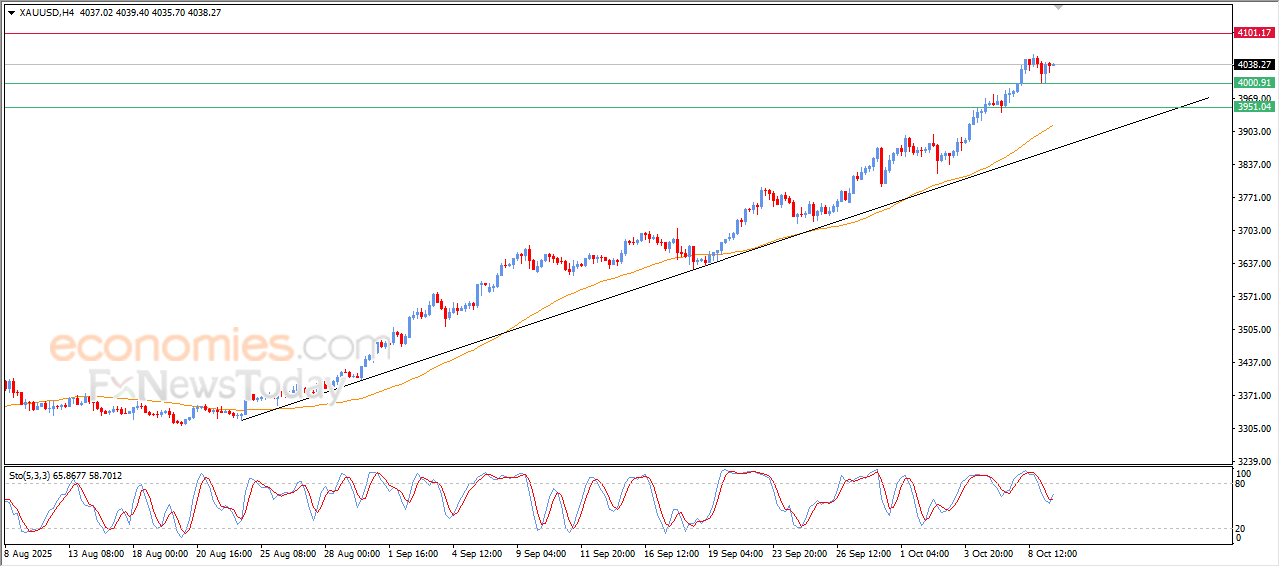
The price of (gold) settled high in its last intraday trading, amid the stability of its trading above $4,000, supported by its continuous trading above its EMA50, and under the dominance of the main bullish trend on the short-term basis and its trading alongside supportive trend line, besides the beginning of positive divergence on the relative strength indicators, where it succeeded in offloading its overbought condition until reaching exaggerated oversold levels compared to the price movement, with the emergence of positive signals from them, opening the way for recording new all-time highs.
VIP Trading Signals Performance by BestTradingSignal.com (Sept 29 – Oct 3, 2025)
Get high-accuracy trading signals delivered directly to your Telegram. Subscribe to specialized packages tailored for the world’s top markets:
US Stock Signals from €44/month
Subscribe via TelegramCrypto Signals from €49/month
Subscribe via TelegramForex Signals from €49/month
Subscribe via TelegramVIP Signals (Gold, Oil, Forex, Bitcoin, Ethereum, Indices) from €179/month
Subscribe via TelegramFull VIP signals performance report for Sept 29 – Oct 3, 2025:
Forecast update for EURUSD -09-10-2025.
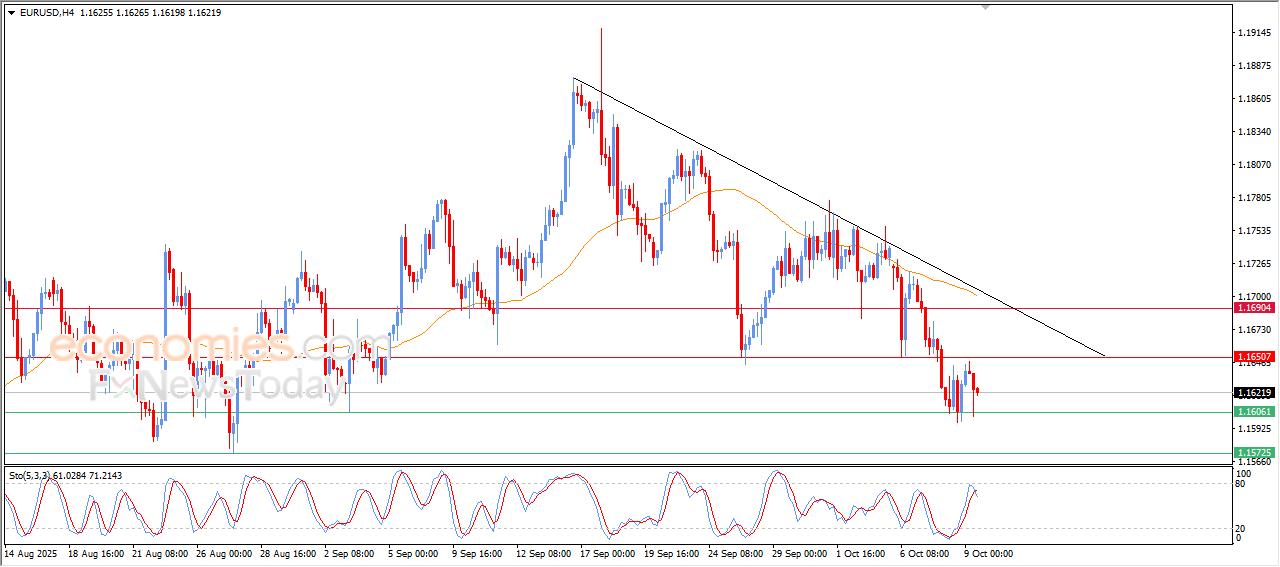
The price of (EURUSD) declined in its last intraday level, amid the continuation of the negative pressure due to its trading below EMA50, and under the dominance of the bearish corrective trend on the short-term basis and its trading alongside trend line, besides the emergence of negative divergence on the relative strength indicators, after reaching exaggerated overbought levels compared to the price moves, with the emergence of the negative signals from there, intensifying the negative pressure.
VIP Trading Signals Performance by BestTradingSignal.com (Sept 29 – Oct 3, 2025)
Get high-accuracy trading signals delivered directly to your Telegram. Subscribe to specialized packages tailored for the world’s top markets:
US Stock Signals from €44/month
Subscribe via TelegramCrypto Signals from €49/month
Subscribe via TelegramForex Signals from €49/month
Subscribe via TelegramVIP Signals (Gold, Oil, Forex, Bitcoin, Ethereum, Indices) from €179/month
Subscribe via TelegramFull VIP signals performance report for Sept 29 – Oct 3, 2025:
The CADJPY resumes the rise– Forecast today – 9-10-2025
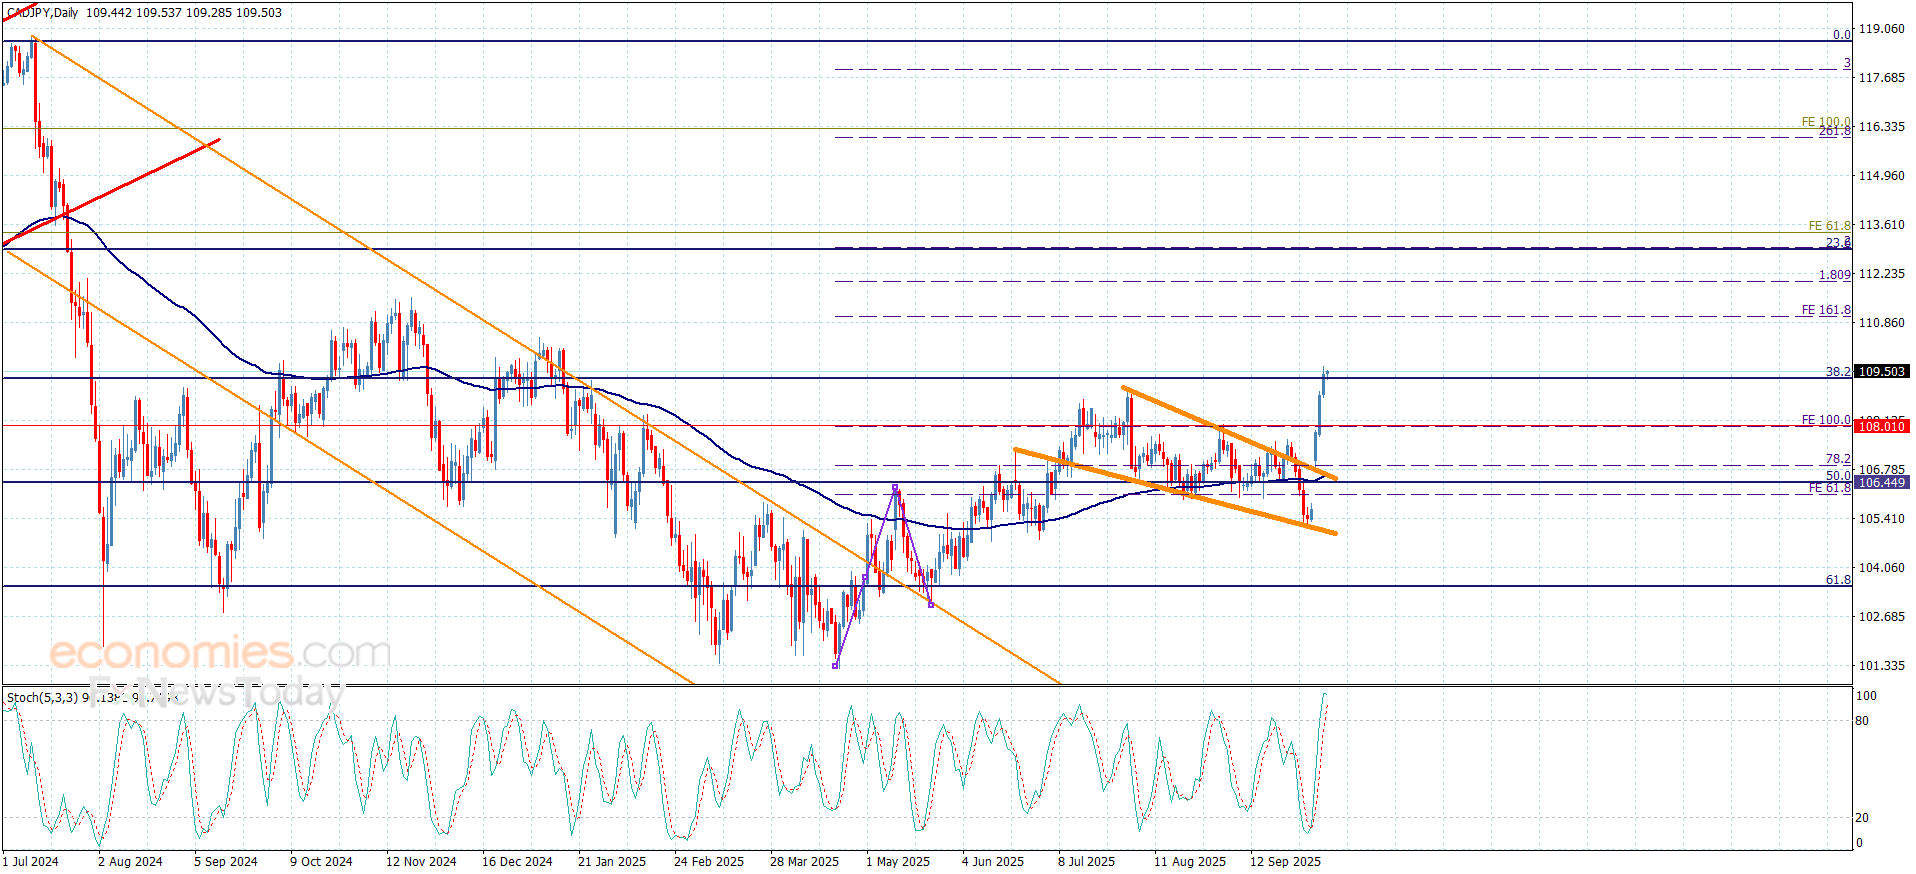
The CADJPY succeeded in resuming the bullish attack, by surpassing the barrier at 108.05 to form a strong bullish rally, to settle above 38.2%Fibonacci correction level at 109.30.
The continuation of providing the main indicators will reinforce the chances of breaching 109.30 level, opening the way to record extra gains that might extend to 109.70 and 110.30.
The expected trading range for today is between 109.00 and 110.30
Trend forecast: Bullish
Natural gas price is under strong bearish pressure– Forecast today – 9-10-2025
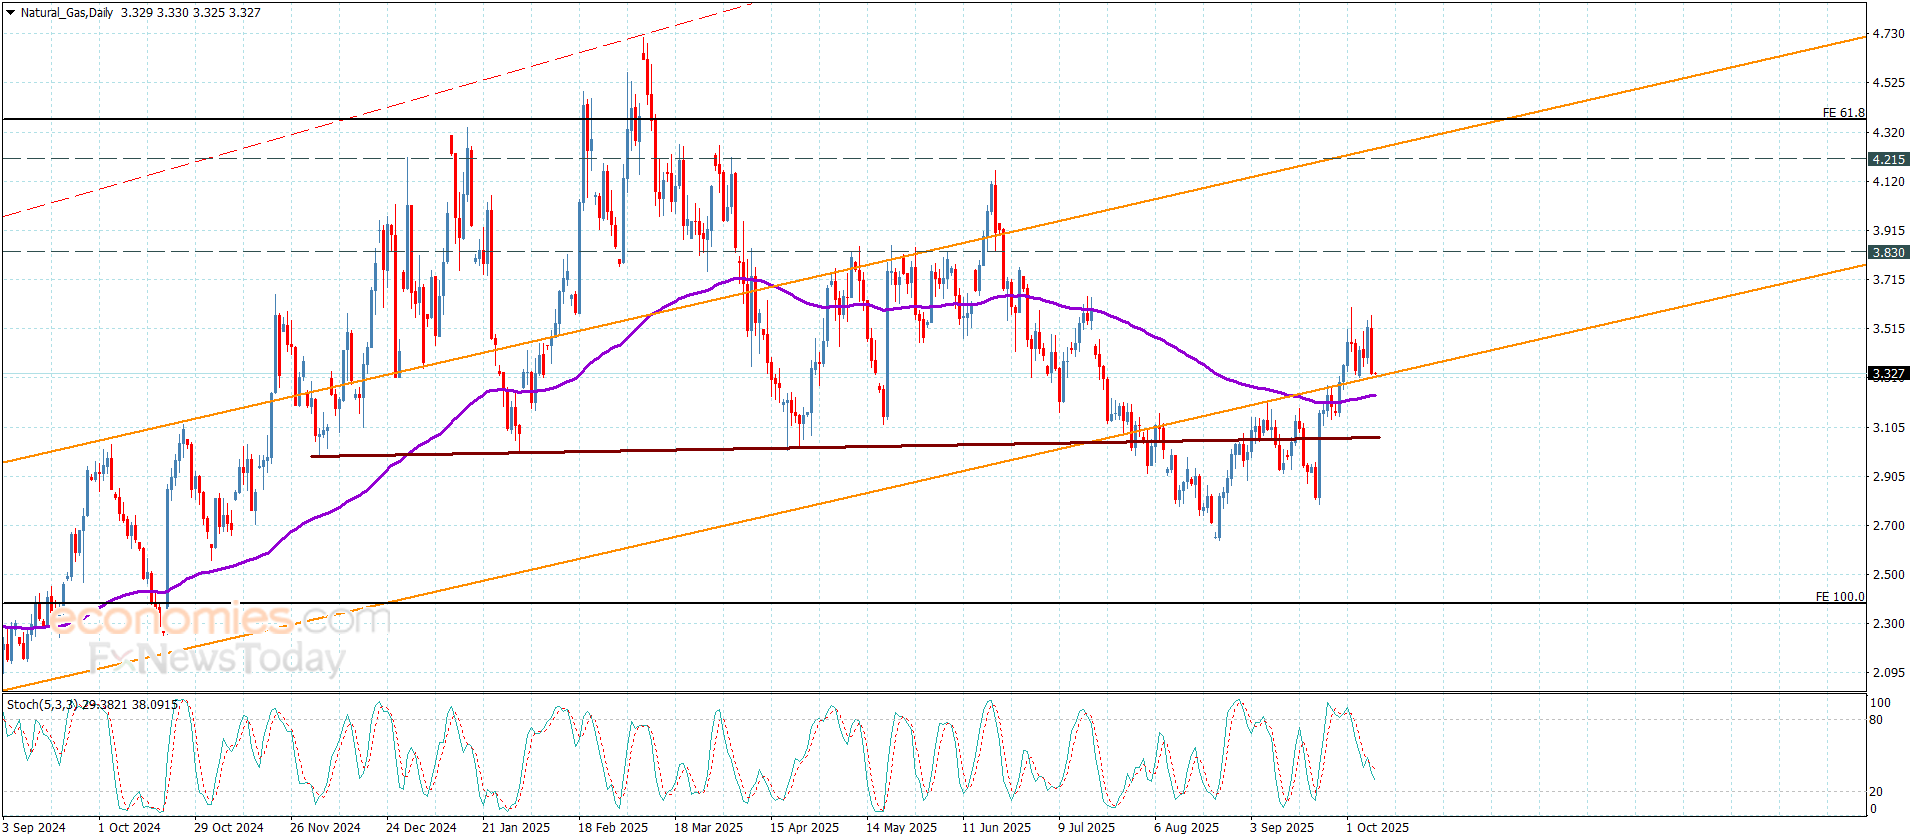
Natural gas prices are under strong negative pressure, which forces it to settle below the barrier at $3.610 and form several bearish waves, to repeat the pressure on the support of the bullish channel at $3.320.
Note that the stability of stochastic below 50 level will increase the negative pressure on the trading, breaking the current support and begin suffering some losses to $3.200 initially, to face the moving average 55 and surpassing it will extend the losses towards $3.050.
The expected trading range for today is between $3.200 and $3.420
Trend forecast: Bearish