Forecast update for Gold -04-08-2025
AI Summary
- Gold price rose on last intraday trading, supported by trading above EMA50 and exiting bearish channel
- Negative signals on RSI suggest potential offloading of overbought levels, which may reduce recent gains
- BestTradingSignal.com offers high-accuracy trading signals for US stocks, crypto, forex, and VIP signals for Gold, Oil, Forex, Bitcoin, Ethereum, and Indices at various subscription prices
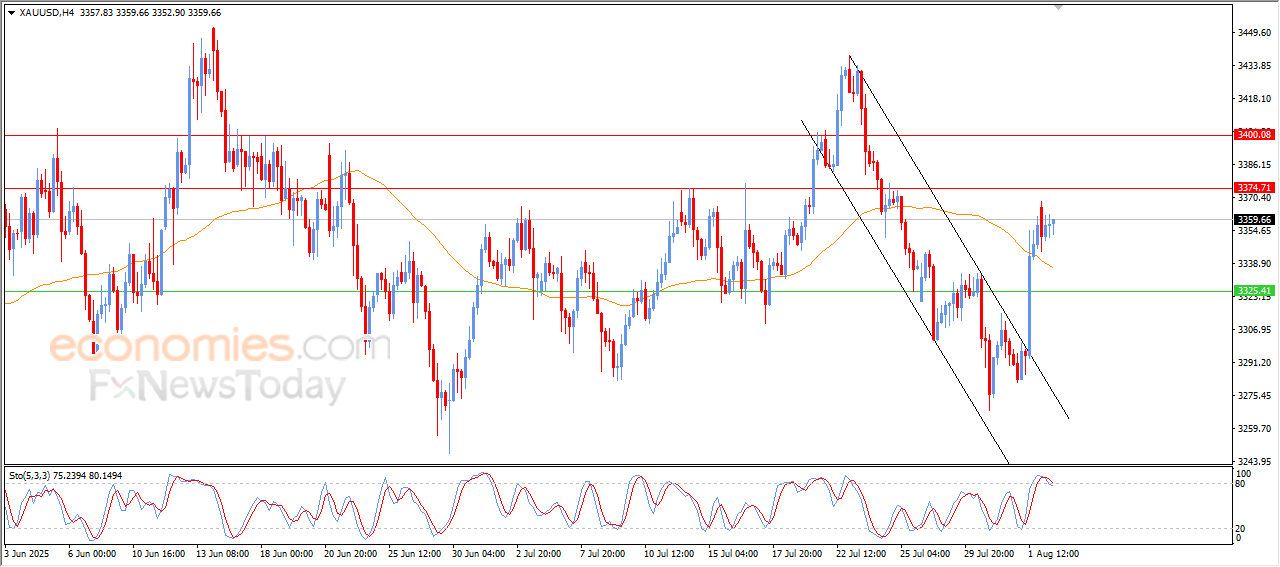
The price of (Gold) rose on its last intraday trading, supported by its trading above its EMA50, which represents a dynamic support that reinforces the bullish track, amid its affection by its exit from bearish channel’s range that limited its trading on the short-term basis, on the other hand, we notice the emergence of the negative signals on the (RSI), after reaching overbought levels, attempting to offload this overbought might reduce the last gains.
BestTradingSignal.com – Professional Trading Signals
Get high-accuracy trading signals delivered directly to your Telegram. Subscribe to specialized packages tailored for the world’s top markets:
US Stock Signals from €44/month
Subscribe via TelegramCrypto Signals from €49/month
Subscribe via TelegramForex Signals from €49/month
Subscribe via TelegramVIP Signals (Gold, Oil, Forex, Bitcoin, Ethereum, Indices) from €179/month
Subscribe via TelegramVIP Trading Signals Performance – July 28 – August 1, 2025
To view the full performance report for this week, visit the following link:
Forecast update for EURUSD -04-08-2025
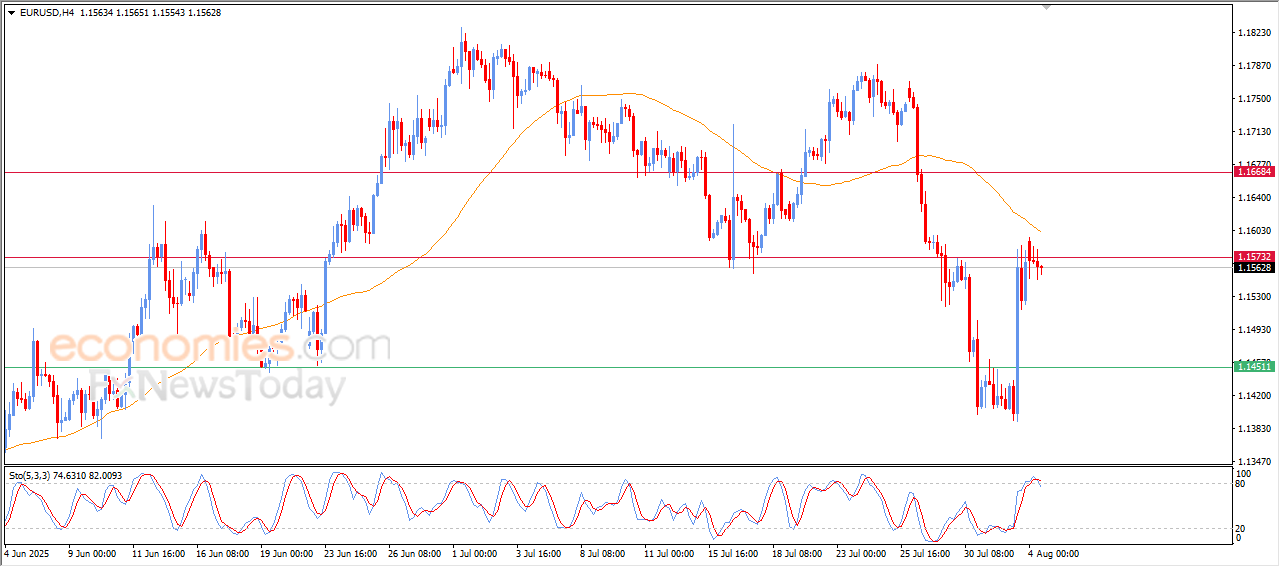
The price of (EURUSD) fluctuated in its last intraday trading, amid its attempts to gain bullish momentum that might assist it to surpass the surrounded negative pressure, the first pressing factor is represented by the continuation of its trading below EMA50, with the emergence of the negative signals on the (RSI), after reaching overbought levels, attempting to offload this oversold condition, gathering its positive strength that might assist it to breach the current resistance level at 1.1575.
BestTradingSignal.com – Professional Trading Signals
Get high-accuracy trading signals delivered directly to your Telegram. Subscribe to specialized packages tailored for the world’s top markets:
US Stock Signals from €44/month
Subscribe via TelegramCrypto Signals from €49/month
Subscribe via TelegramForex Signals from €49/month
Subscribe via TelegramVIP Signals (Gold, Oil, Forex, Bitcoin, Ethereum, Indices) from €179/month
Subscribe via TelegramVIP Trading Signals Performance – July 28 – August 1, 2025
To view the full performance report for this week, visit the following link:
The CADJPY remains bullish– Forecast today – 4-8-2025
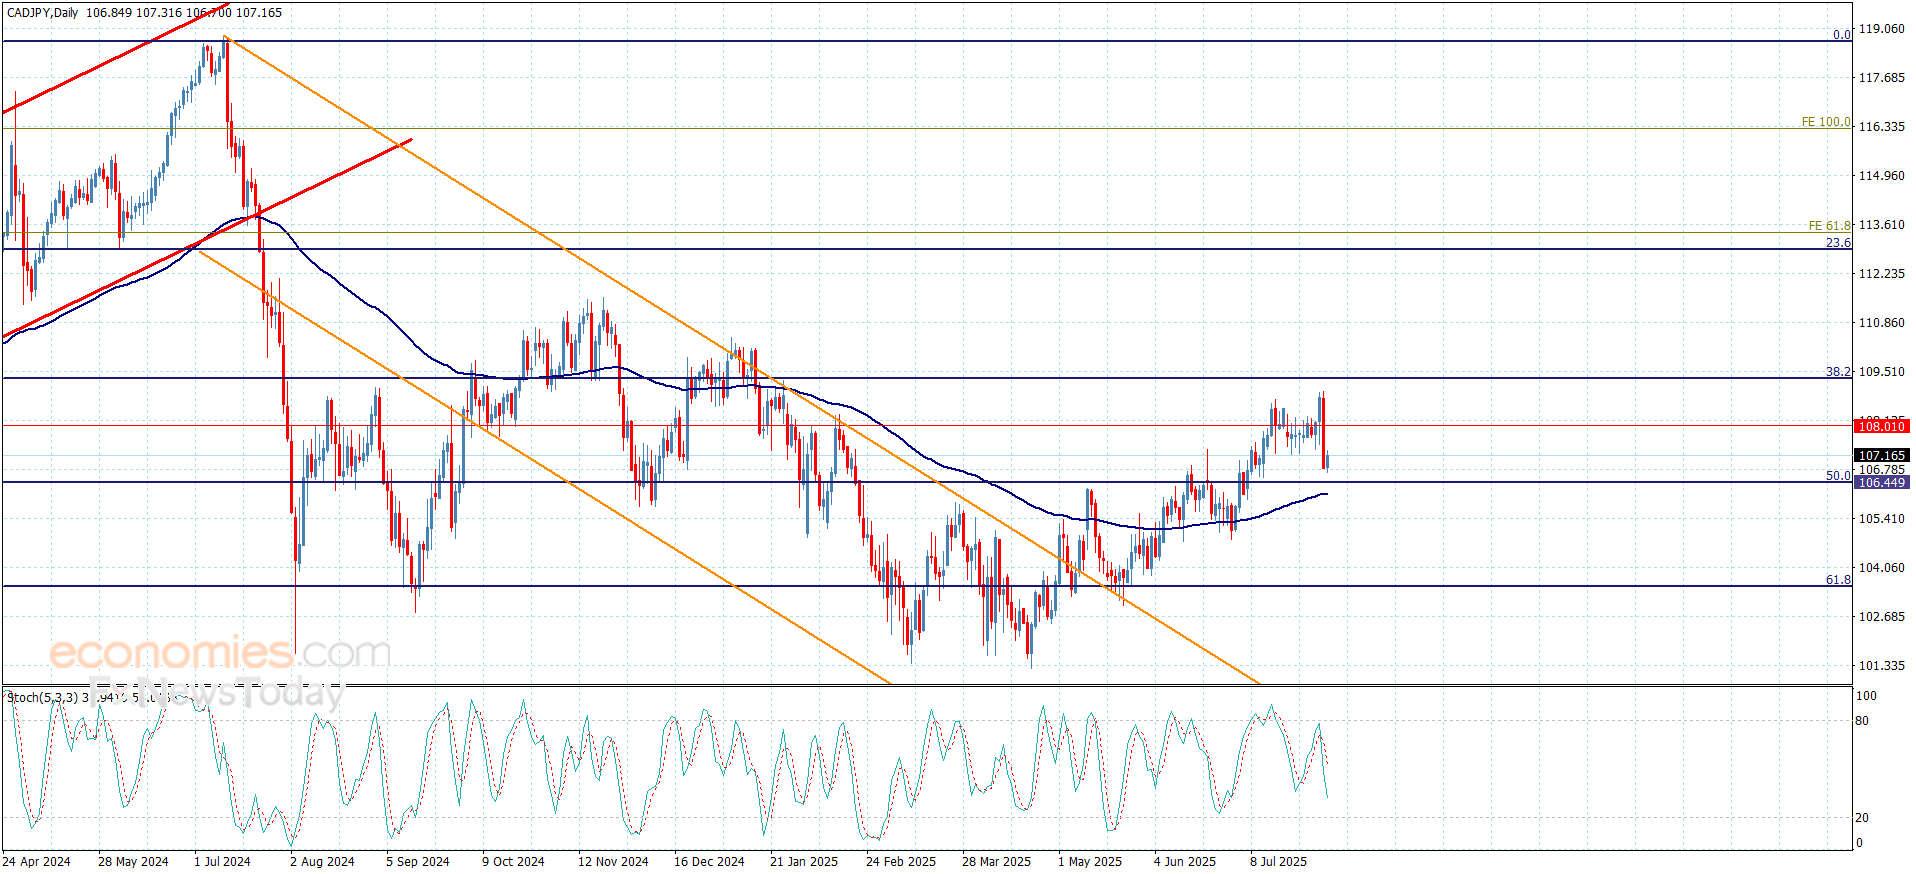
Despite facing strong bearish pressures and forming sharp decline by targeting 106.70, the main bullish track of the CADJPY remains valid by its stability above 50%Fibonacci correction level, which represents an important support at 106.40.
Note that the possibility of forming sideways trading due to the contradiction between the main indicators, but the stability above the mentioned support will reinforce the chances for gathering the positive momentum, to ease the mission of its rally to 108.10, surpassing this obstacle might extend the trading to the next main target at 109.30.
The expected trading range for today is between 106.50 and 107.90
Trend forecast: Bullish
Natural gas price repeats the pressure on the support– Forecast today – 4-8-2025
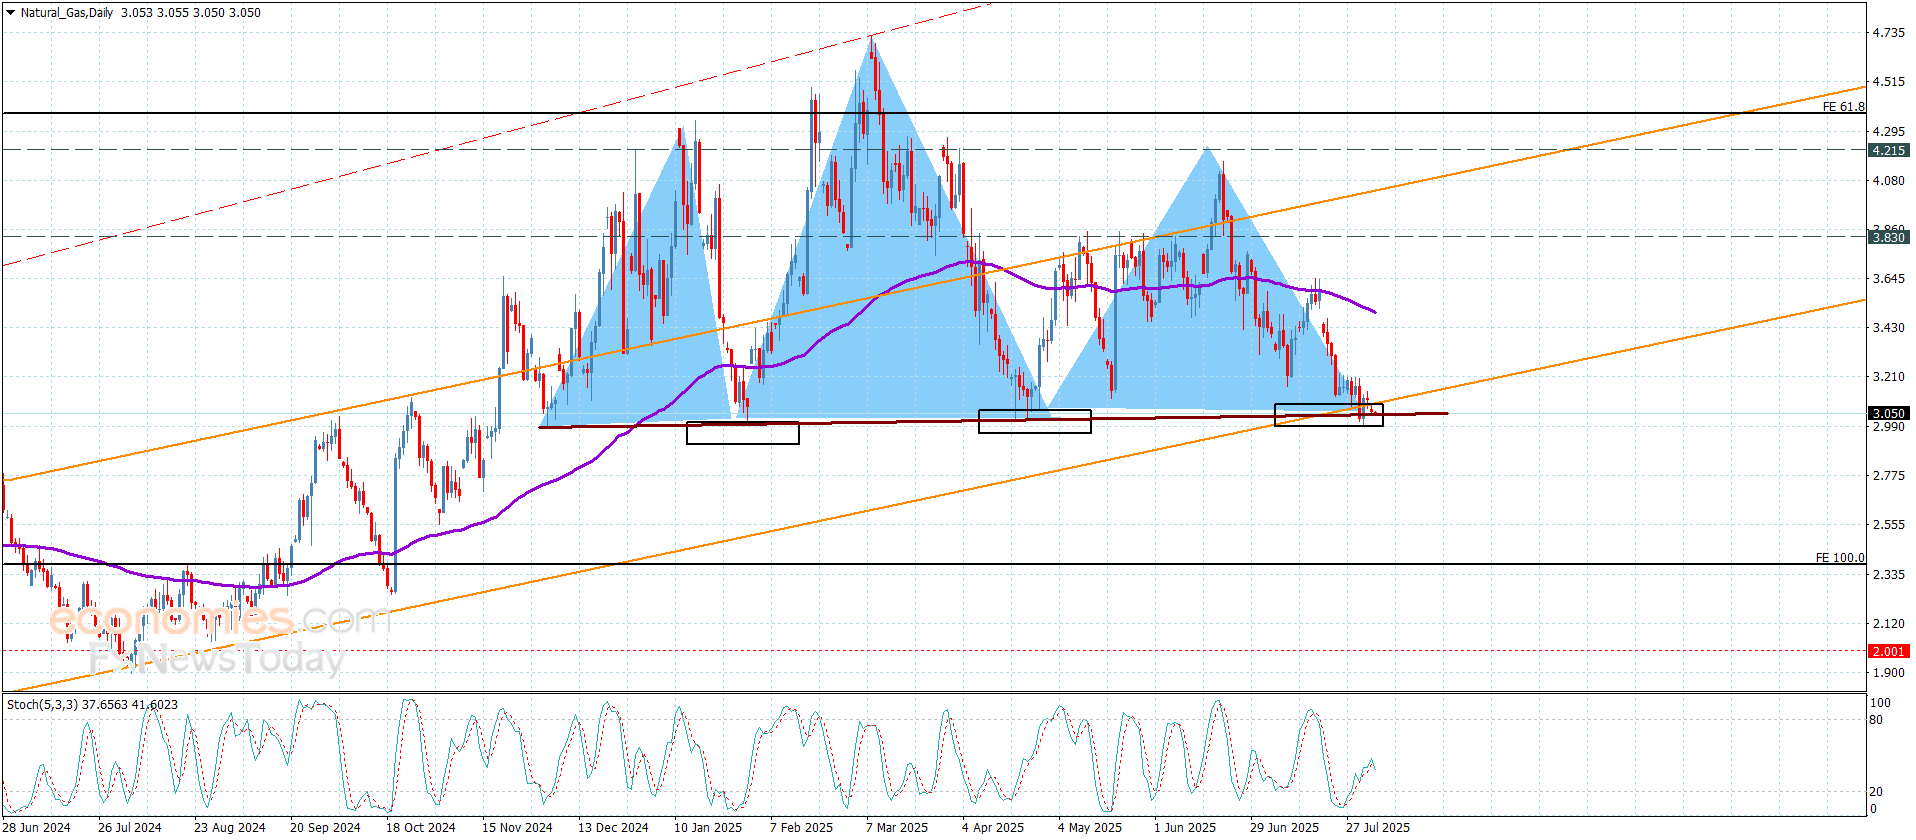
Natural gas price remains affected by the negativity of the main indicators besides its negative stability below $3.320 level, to notice renewing the negative pressure on the neckline of the head and shoulders pattern at $3.000, reminding you that breaking this level will confirm the price move to a new negative station, forcing it to suffer deep losses that might begin at $2.710 and $2.390, we should wait for achieving the break and confirming a negative close below it to avoid any losses that might be caused by the price attempt to regain the bullish bias.
The expected trading range for today is between $2.710 and $3.150
Trend forecast: Bearish