


 |
|
Evening update for gold-29-07-2026
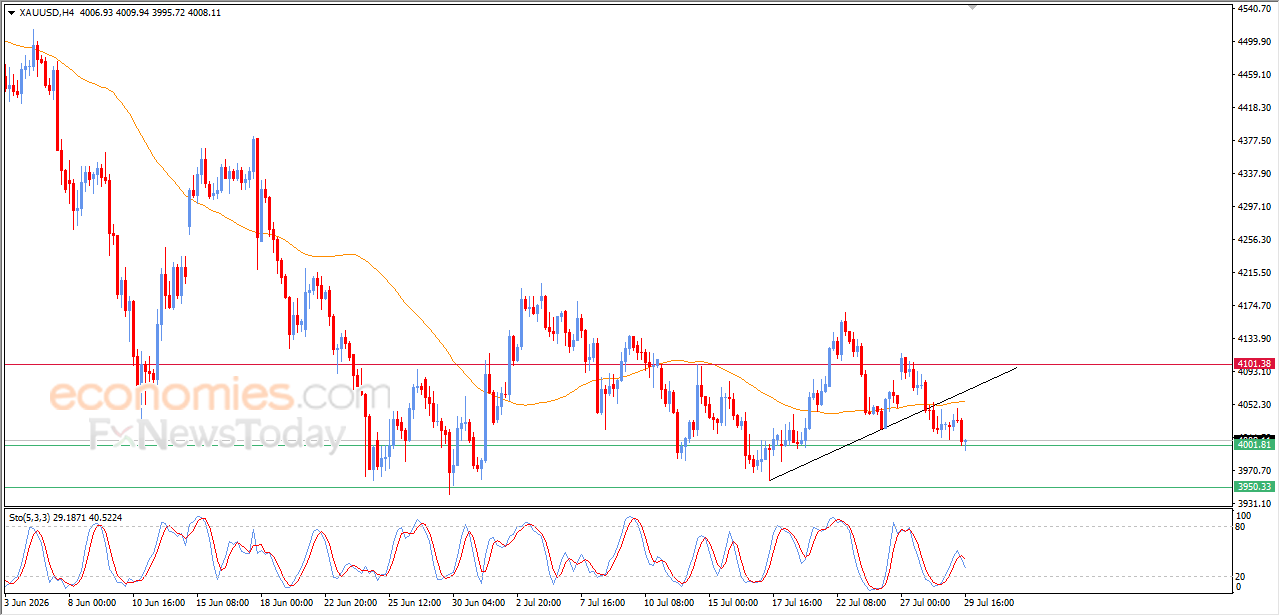
Gold settles in its recent intraday trading, breaking the psychological support level of $4,000, amid the continuation of the negative pressure that comes from its trading below EMA50, reducing the chances of full recovery in the near upcoming period, especially with the emergence of negative overlapping signals on the relative strength indicators, after offloading its oversold conditions, opening the way for recording more losses.
Evening update for EURUSD-29-07-2026
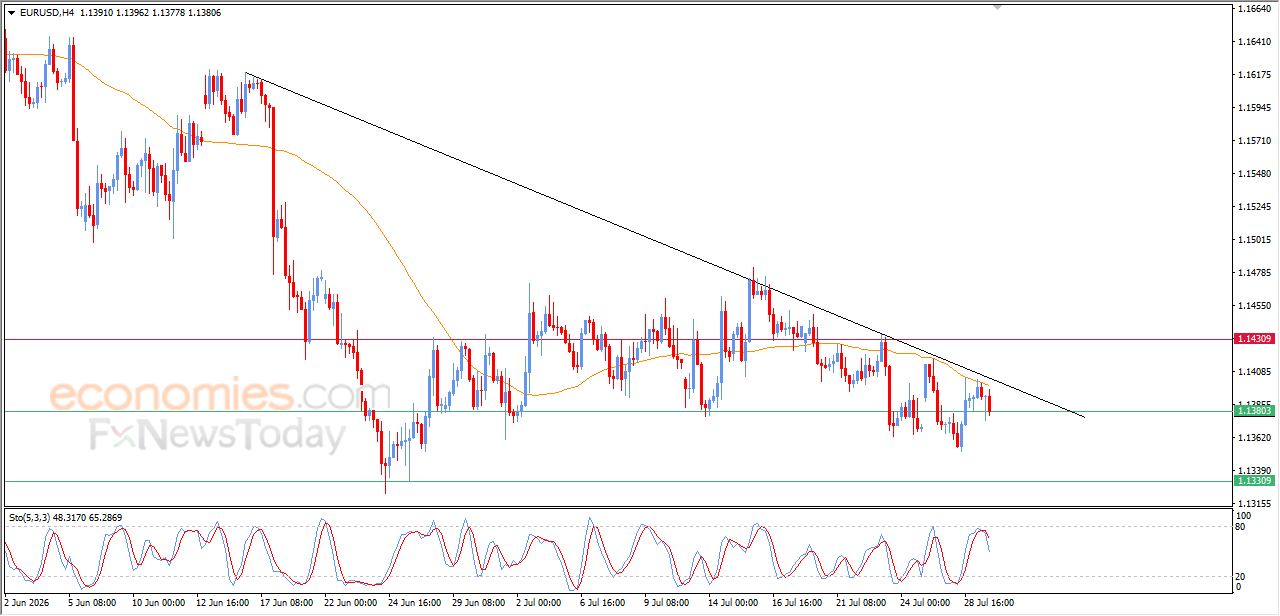
EURUSD price declined in its last intraday trading, after forming negative divergence on the relative strength indicators, after reaching overbought levels, exaggeratedly compared to the price action, with the emergence of the negative signals from them, amid the dominance of the main bearish trend on the short-term basis with the continuation of the negative pressure that comes from its trading below EMA50, intensifying the negative pressure on the pair.
MoreCardano touches SMA resistance - Analysis - 29-07-2026
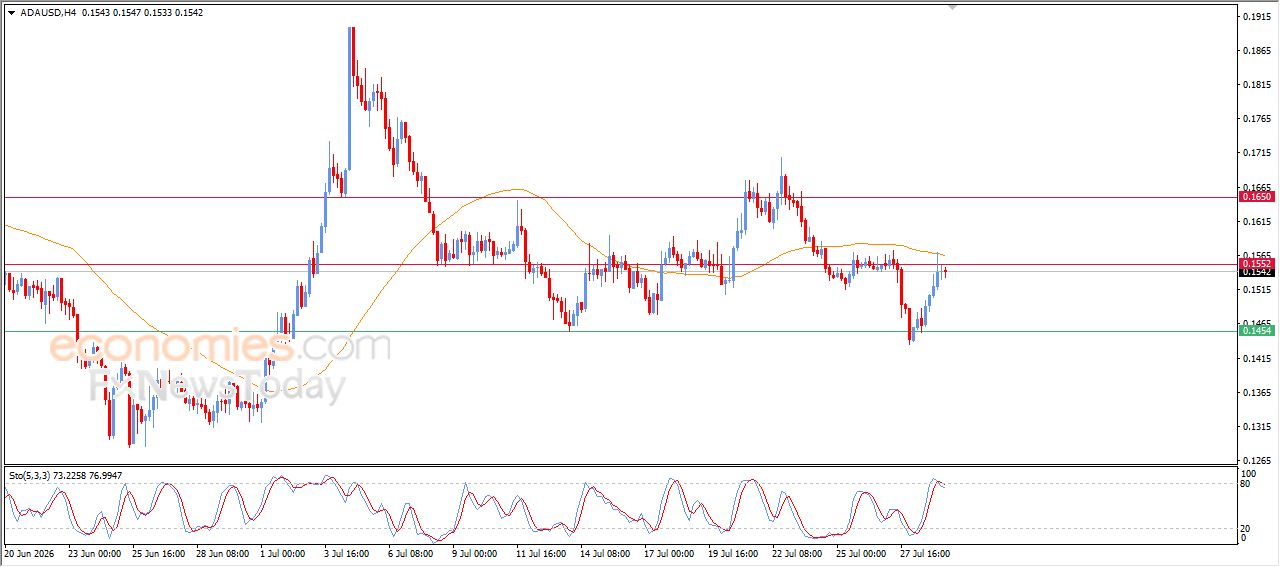
Cardano (ADAUSD) held on to its recent gains in the latest intraday trading sessions, with the cryptocurrency's latest advance bringing it into contact with its 50-period Simple Moving Average (SMA), which is acting as dynamic resistance and threatening to trigger a bearish reversal. Meanwhile, momentum indicators are beginning to form a bearish divergence after reaching extremely overbought levels relative to the price action, with fresh bearish signals now starting to emerge, adding to the downside pressure. This comes as the cryptocurrency remains under the control of a short-term bearish corrective trend.
MoreTexas Instruments price readies to pierce pivotal support - Forecast today - 29-07-2026
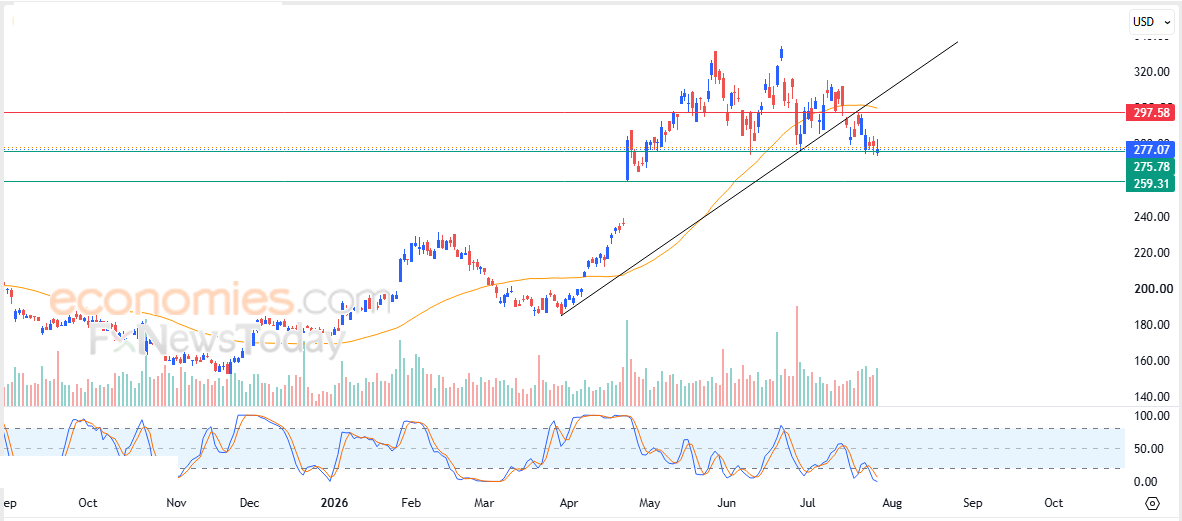
Texas Instruments Incorporated (TXN) moved lower in recent intraday trading and is now preparing to test the key support level at $275.80. The stock remains under pressure after previously breaking below a short-term ascending trendline, while continuing to trade beneath its 50-day Simple Moving Average (SMA), which is acting as dynamic resistance and limiting the prospects for a sustained recovery in the near term. Meanwhile, momentum indicators continue to generate bearish signals despite remaining in extremely oversold territory, reinforcing the prevailing downside bias.
More