Evening update for gold-19-06-2026
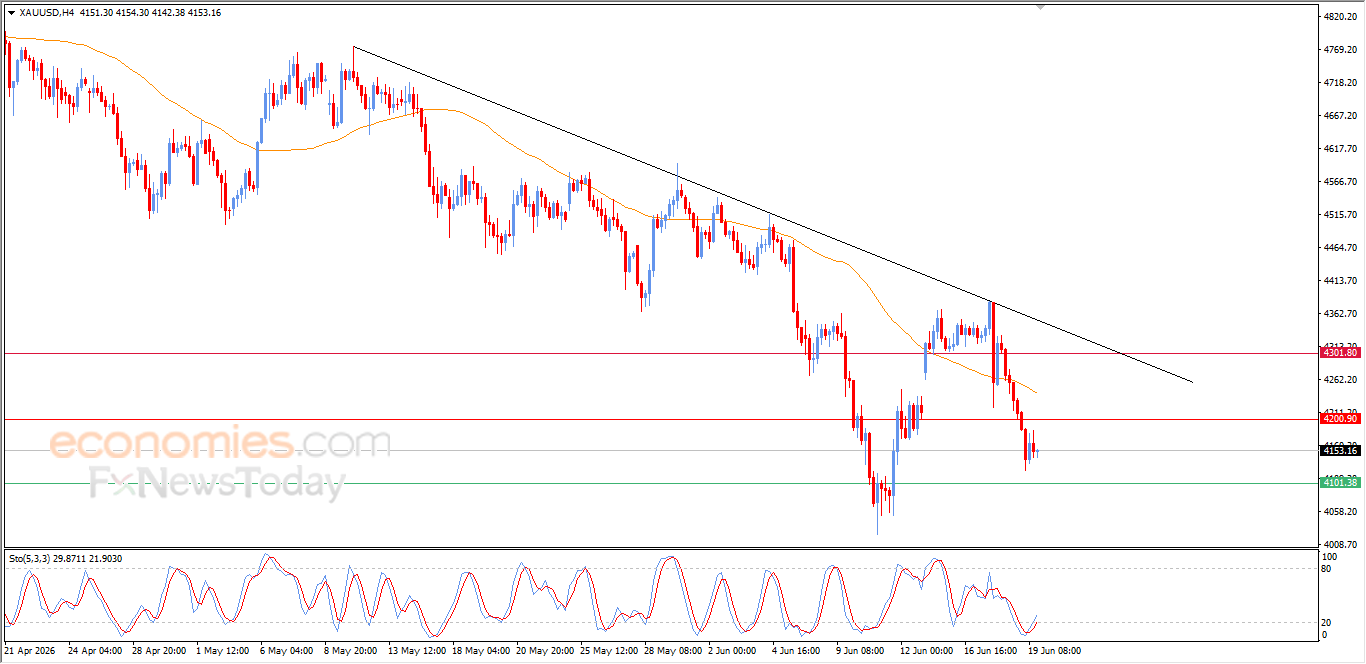
Gold settles lower during its latest intraday trading, with the continuation of the negative and dynamic pressure that is represented by its trading below EMA50, reducing the chances of a full recovery in the upcoming near period, especially with the dominance of the main bearish trend on the short-term basis, and the trading alongside supportive trend line for this path, on the other hand, we notice the emergence of the positive signals from the relative strength indicators, on the other hand, after reaching oversold levels, which helped the price to settle.
Evening update for EURUSD-19-06-2026
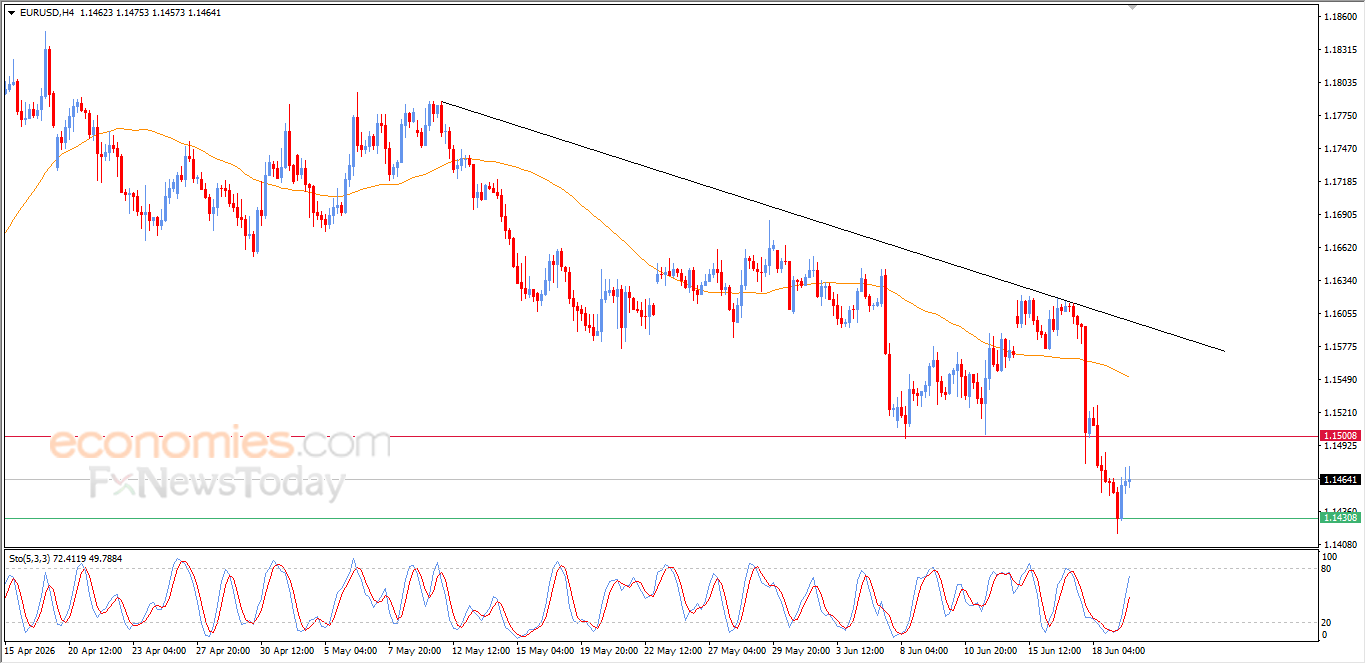
The EURUSD pair continues to hold onto its gains during its latest intraday trading, supported by positive signals from the relative strength indicators after offloading its oversold conditions. despite this support, the bearish scenario remains in place, as the pair is still under negative pressure from trading below EMA50, which reinforces the stability and dominance of the main short-term downtrend.
Forecast update for Ethereum -19-06-2026
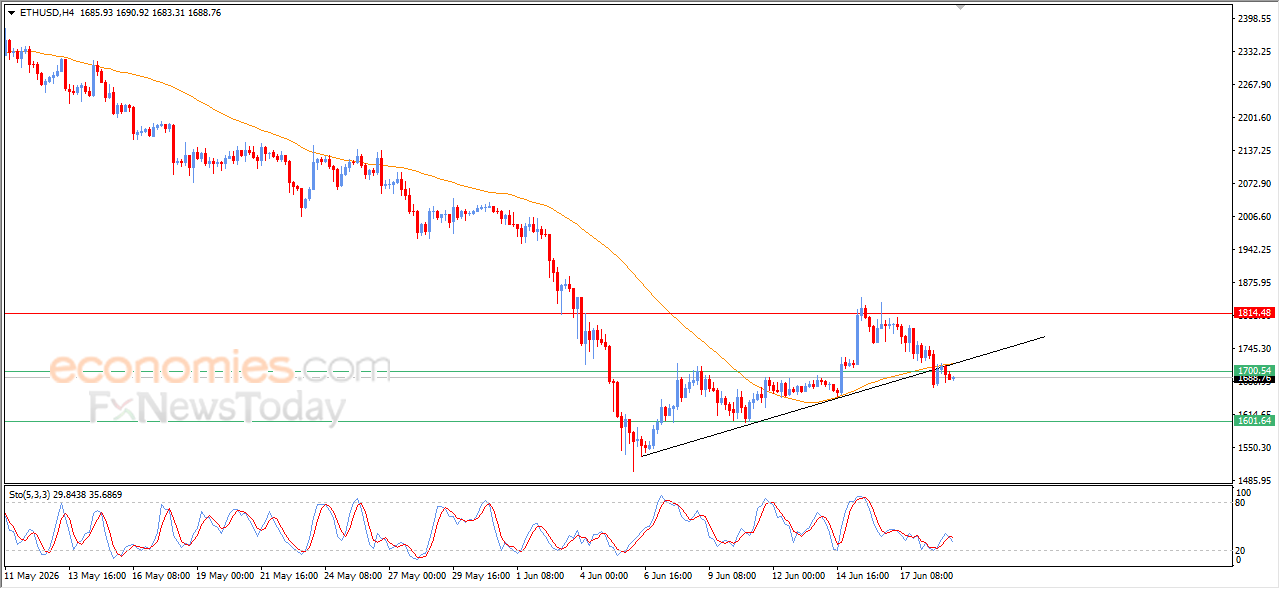
Ethereum (ETHUSD) declined during its latest intraday trading sessions after managing, in early trading today, to ease part of its oversold conditions on the relative strength indicators, opening the way for the price to target new support levels in the near term, especially with the beginning of a negative crossover appearing on these indicators.
The price has also confirmed a break below a short-term corrective ascending trendline, while facing negative pressure due to trading below EMA50, which increases the downside pressure surrounding the price.
Forecast update for Brent -19-06-2026
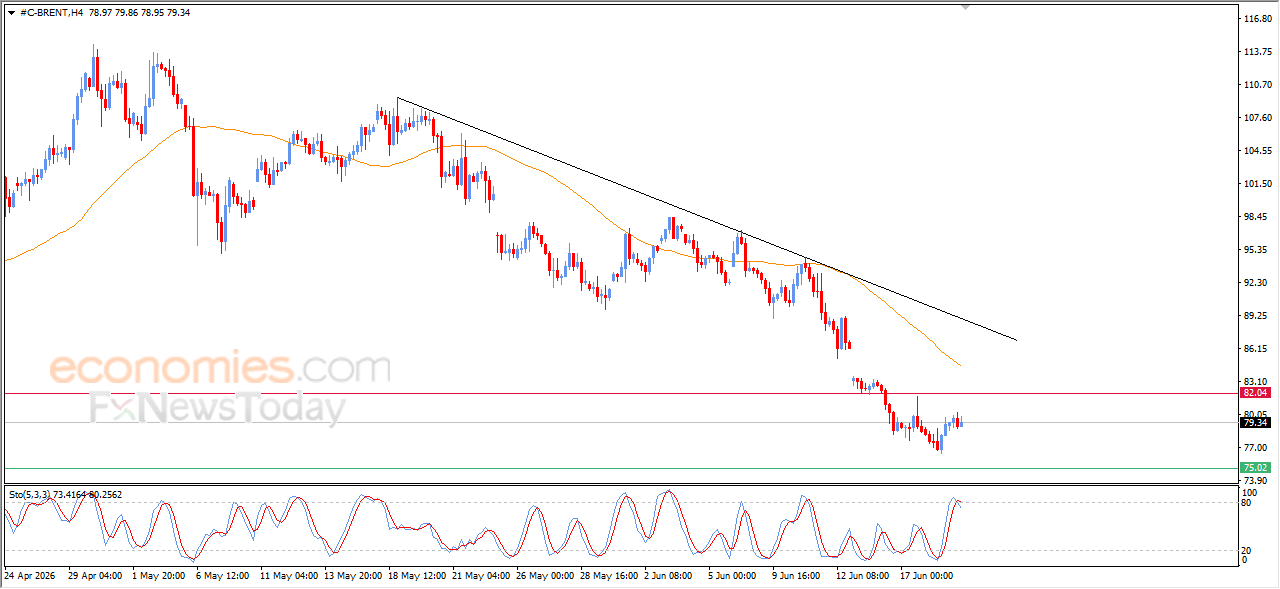
Brent crude oil is holding onto cautious gains during its latest intraday trading, while a negative crossover has started to appear on the relative strength indicators, after reaching extremely overbought levels, showing excessive buying pressure compared with the price movement. This is a clear indication of the beginning of a negative divergence formation that threatens the recent gains, especially with the short-term main bearish trend remaining dominant and price movements continuing along a trendline that supports this downward path.