


 |
Evening update for gold-15-04-2026
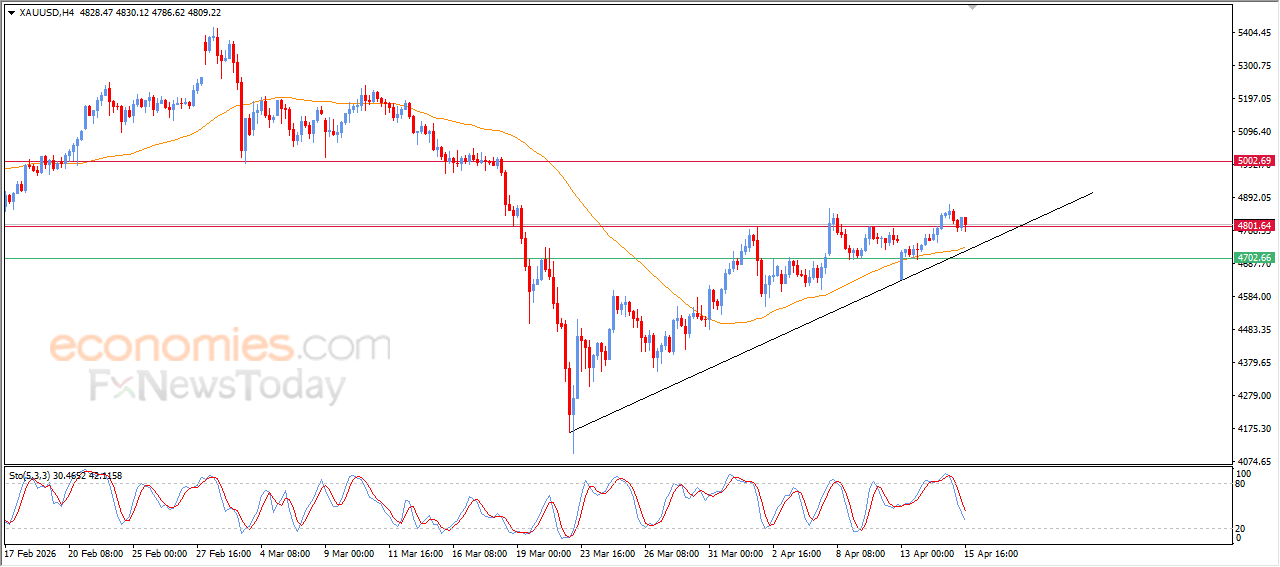
Gold price declined in its last intraday trading, amid the emergence of the negative signals from the relative strength indicators, after reaching overbought levels, to attempt to gain bullish momentum that might help it to recover and rise again, amid the continuation of the dynamic support that is represented by its trading above EMA50, under the dominance of bullish corrective wave on short-term basis.
Thanks for your feedback.
Evening update for EURUSD-15-04-2026
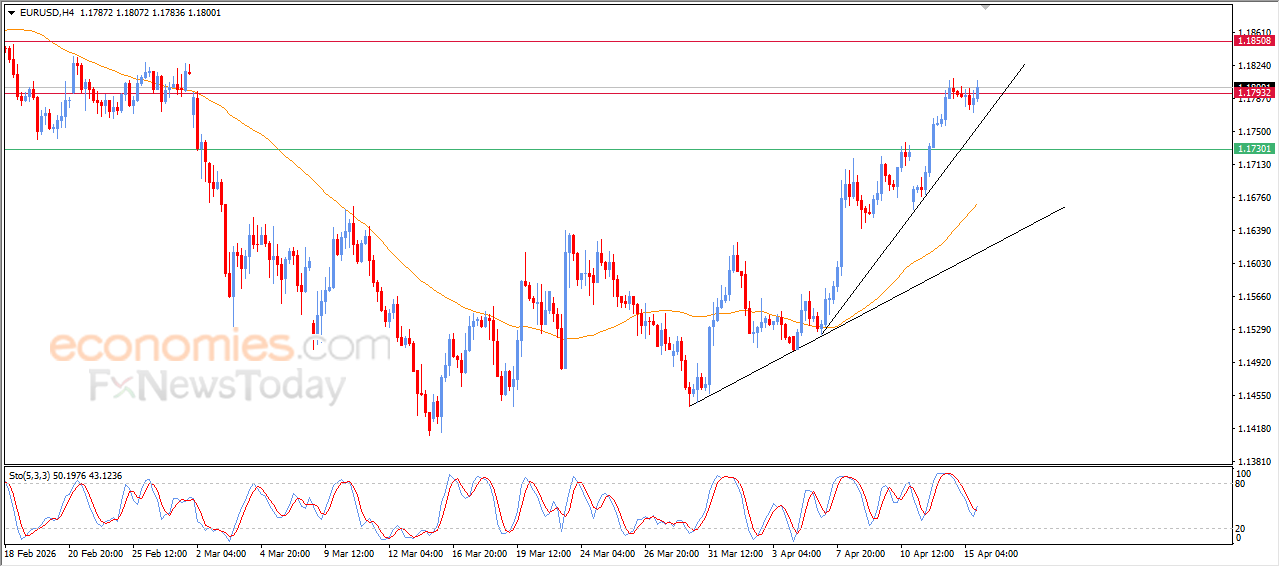
The EURUSD pair rose in its last intraday trading, amid the attempts to breach 1.1790 resistance, taking advantage of the continuation of the positive support due to its trading above EMA50, and the trading alongside steep minor bullish trend line that indicates the strength of the positive momentum around it. Noticing the emergence of the positive signals from the relative strength indicators, after reaching exaggerated oversold levels compared to the price move.
MoreLitecoin price receives positive push - Analysis - 15-04-2026
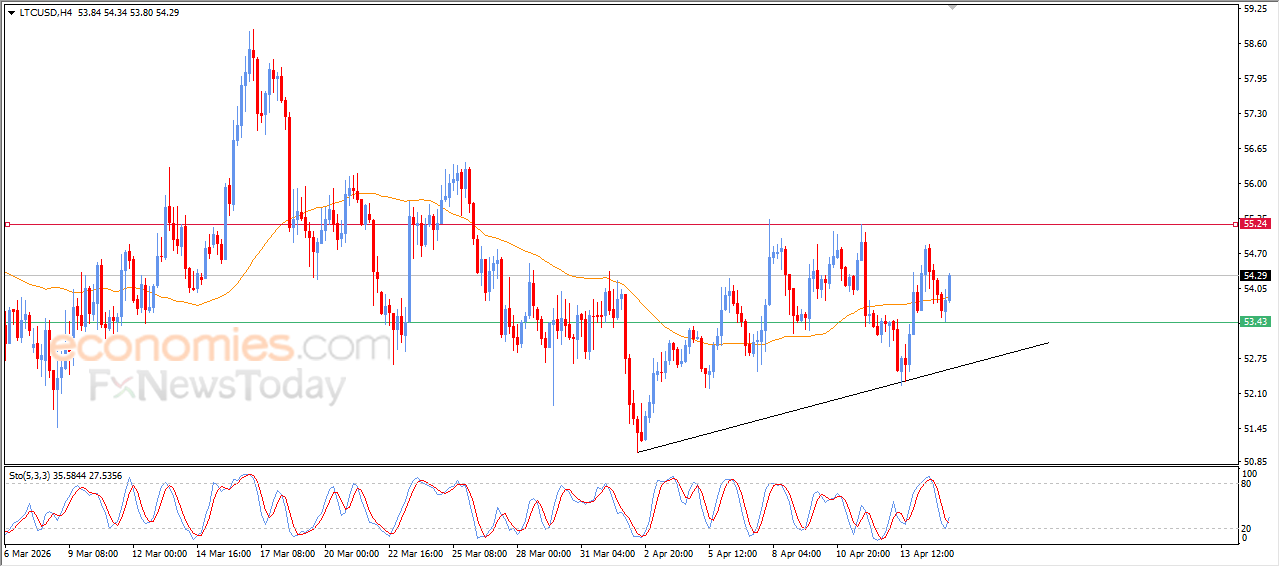
Litecoin (LTCUSD) price rose in its latest intraday trading, after leaning on the support of its 50-day SMA. This provided the coin with positive momentum that helped it achieve these gains, amid the dominance of a short-term bullish corrective trend as it moves alongside a trendline supporting this path. Additionally, a positive crossover is beginning to emerge in the Stochastic indicator after reaching deeply oversold levels.
MoreMcCormick & Co price tries to correct the main downward trend - Forecast today - 15-04-2026
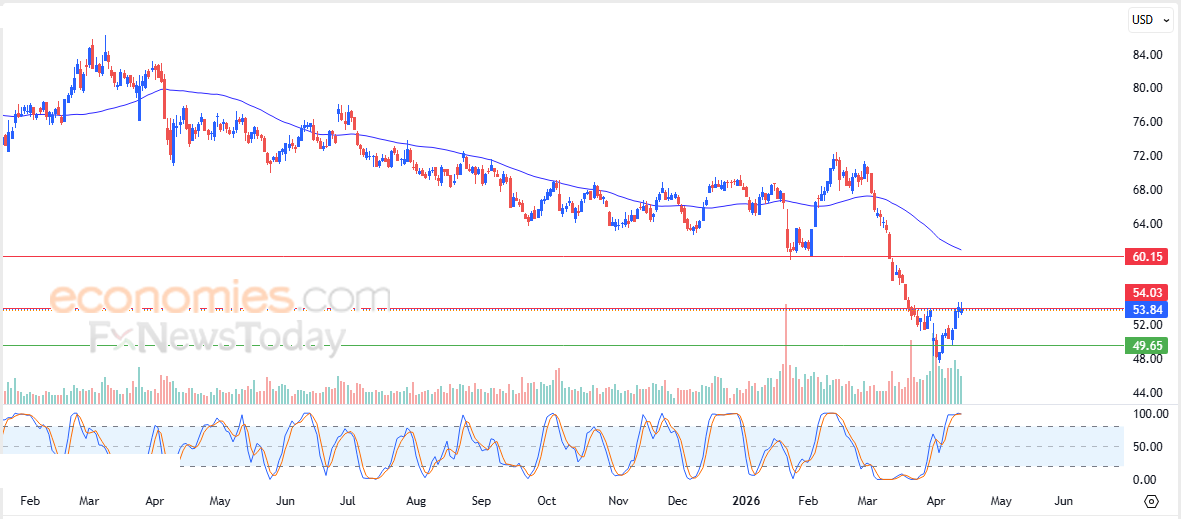
McCormick & Company, Incorporated (MKC) stock price has stabilized with a series of consecutive gains in its latest intraday sessions, as the stock attempts to correct the main bearish trend in the medium and short term. This comes amid continued negative pressure from trading below its 50-day SMA, which limits the chances of a full recovery in the near term. This is especially true as a negative crossover begins to appear in the Stochastic indicator after reaching extremely overbought levels that are exaggerated relative to price action, suggesting the beginning of a negative divergence.
More