


 |
Evening update for Gold -27-11-2025
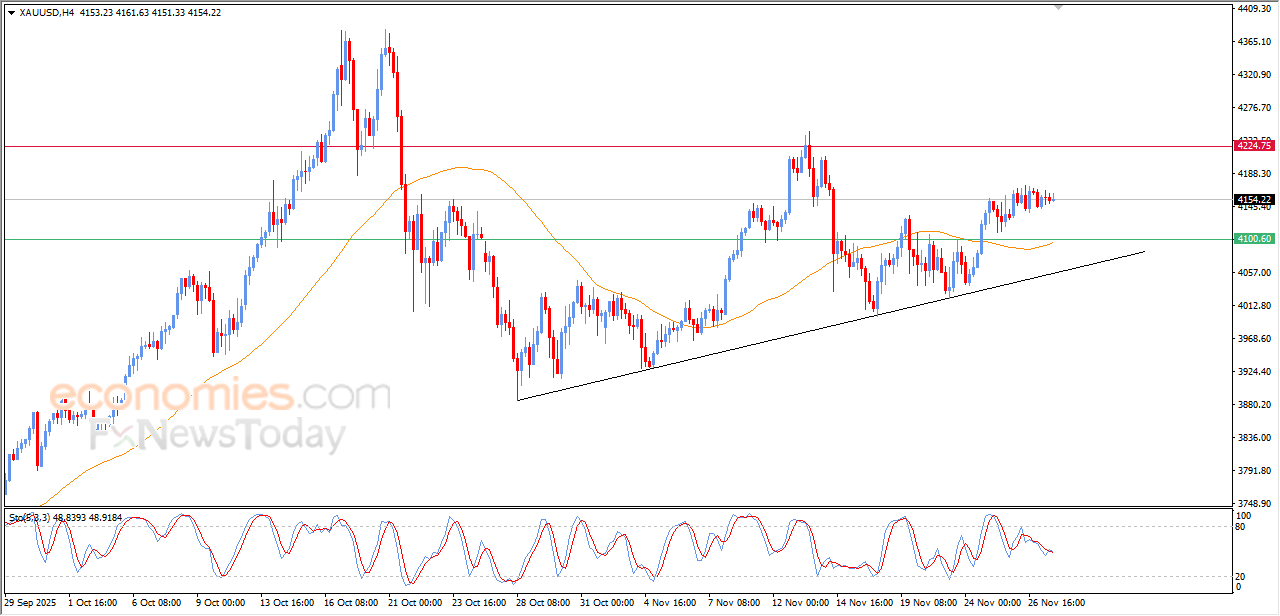
(Gold) witnessed fluctuated trading within limited range of sideways trading, amid its attempts to gain bullish momentum that might help it to recover and rise again, amid the dominance of the main bullish trend and its trading alongside minor trend line on the short-term basis, with the emergence of positive overlapping signals on the relative strength indicators, after reaching exaggerated oversold levels compared to the price move.
Thanks for your feedback.
Evening update for EURUSD -27-11-2025
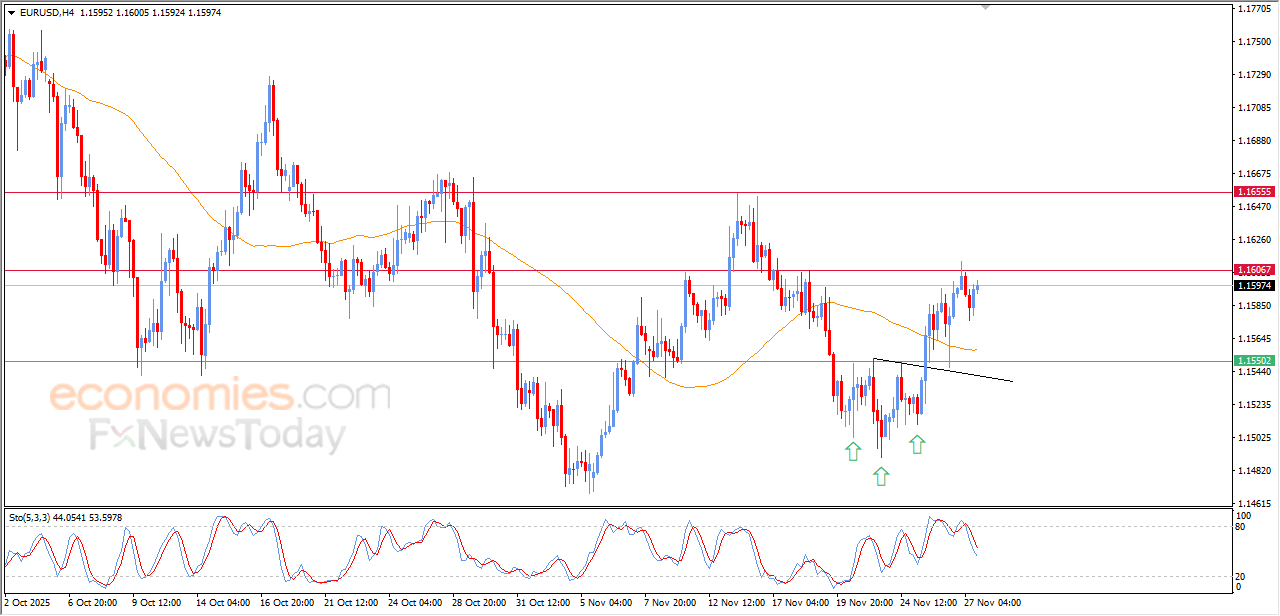
The (EURUSD) rose in its last intraday trading, after offloading its overbought conditions on the relative strength indicators, opening the way for achieving more gains on the near-term basis, preparing to attack 1.1695 resistance, amid the continuation of the positive pressure that comes from its trading above EMA50, and under the dominance of bullish corrective wave on the short-term basis.
MoreCardano price tries to vent off overbought saturation - Analysis - 27-11-2025
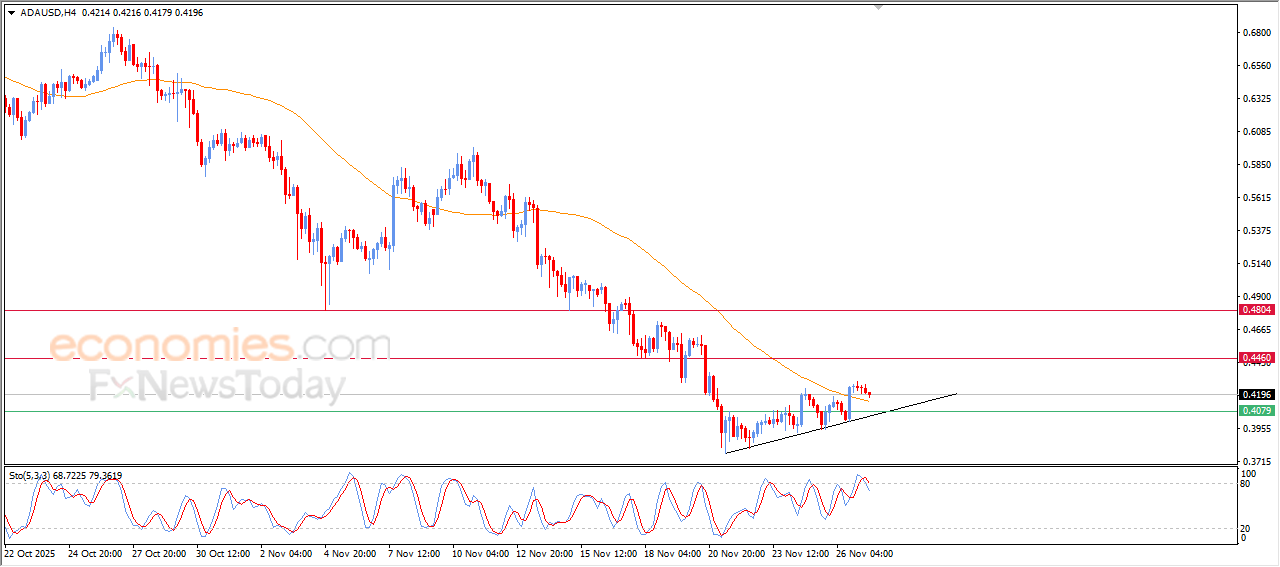
Cardano (ADAUSD) declined in its latest intraday trading, as the price attempts to gain positive momentum that may help it recover and rise again. At the same time, it is trying to relieve part of its overbought saturation on the RSI indicators, especially with the beginning of negative signal inflows. This comes under the dominance of a short-term corrective upward wave with the price moving along a trendline, supported by dynamic backing from trading above its 50-day SMA, which strengthens the likelihood of a near-term recovery.
MoreDash price exposed to negative pressure - Analysis - 27-11-2025
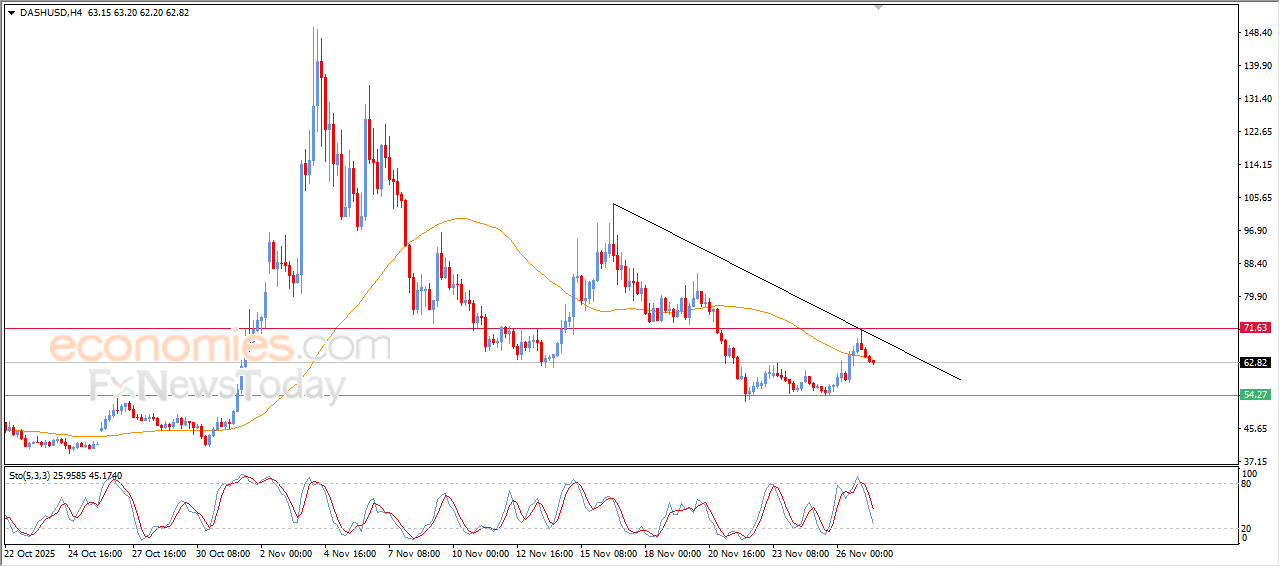
Dash (DASHUSD) declined in its latest intraday trading, under the dominance of the main short-term descending trend, with the price moving alongside a secondary trendline supporting this bearish structure. Negative signals continue to appear on the RSI indicators after they reached extremely overbought levels, and in its recent movement the price broke below its 50-day SMA, which further intensifies the surrounding negative pressure.
More