Copper Technical Analysis
Economies.com provides the latest technical analysis of Copper. Through this page you may keep track of any changes in Copper Prices by our live technical updates around the clock. Technical analysis helps you predict the trend of Copper Rates by the use of technical indicators.
Copper price - Last update: 2026-07-08 18:25 UTC
6.1295
Copper price is slow– Forecast today – 8-7-2026
2026-07-08 05:13 UTC
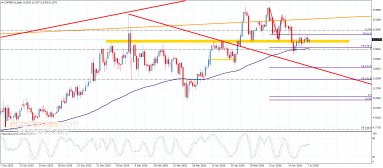
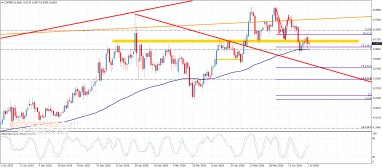
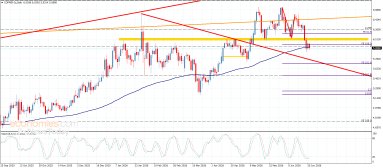
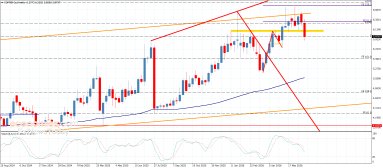
Copper price forced to provide slow sideways trading, due to the contradiction of the main indicators against holding below $6.3000 barrier, the price needs to settle below $5.9500 level, ...
Copper price prefers the negativity– Forecast today – 7-7-2026
2026-07-07 05:18 UTC
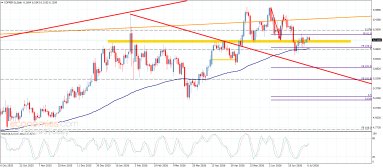
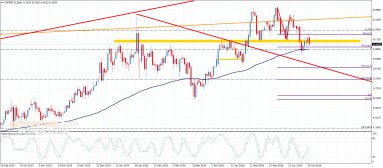
Despite the weakness of copper’s last trading, providing negative closes below $6.3000 supports the chances of activating the bearish corrective trend in the near and medium ...
Copper price is fluctuating below the barrier– Forecast today – 6-7-2026
2026-07-06 05:08 UTC
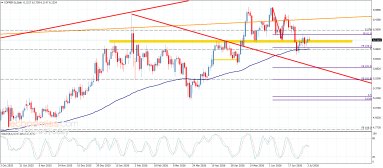
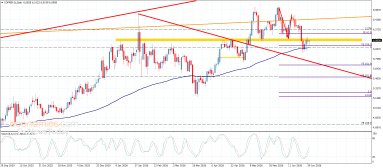
Copper price remains stable until this moment below $6.3000 barrier, however the sideways fluctuation has been caused by the contradiction of the main indicators, which forces it to ...
Copper price settles above the moving average– Forecast today – 3-7-2026
2026-07-03 07:41 UTC
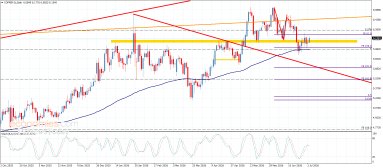
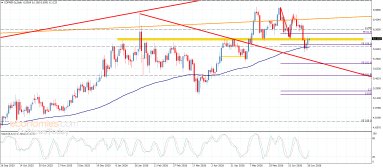
Copper price settles above the moving average 55 near $5.9500, to announce delaying the bearish corrective attempts, noticing its rally to settle near $6.1500 level, surrendering to the ...
Copper price is waiting to achieve the break– Forecast today – 2-7-2026
2026-07-02 05:42 UTC
Copper price remains stable until this moment above the moving average 55, which keeps forming extra support level at $5.9500, obstructing the chances of resuming the previously waited ...
Copper price settles below the barrier– Forecast today – 1-7-2026
2026-07-01 05:14 UTC
Copper price ended the last positive rebound by reaching $6.2000 level, to begin forming bearish corrective trading, affected by the stability below $6.300 barrier, to reach $6.0500 ...
Copper price provides sideways trading– Forecast today – 30-6-2026
2026-06-30 05:15 UTC
Copper price is affected by the positivity of the main indicators since yesterday, specifically by forming extra support by the moving average 55 at $5.9500, which obstructs the bearish corrective ...
Copper price ended the last trading by reaching $5.9200 level, as it faced the moving average 55, to begin forming a positive rebound, to settle near the broken support at $6.1000 ...
Copper price presses on the moving average 55– Forecast today – 26-6-2026
2026-06-26 06:40 UTC
Copper price confirmed its commitment to the corrective bearish trend by posting new negative closes below the $6.1000 barrier. The price renews the attempt of pressing on the moving ...
Copper price continues its corrective decline – Forecast today – 25-6-2026
2026-06-25 05:17 UTC
Copper continued forming bearish corrective movements since yesterday’s trading, taking advantage of its break below the additional support level at $6.1000. The price managed to reach ...