Copper Shines as the Metal of the Future: Why Are Traders Rushing to Invest in It Now?

Copper is one of the essential metals that plays a vital role in the global economy due to its extensive applications in sectors such as infrastructure, electronics, electric vehicles, and clean energy.
With the global trend toward green energy and renewable energy sources, the demand for copper is increasing, leading analysts and investors to view this metal as a strategic asset in the coming years.
In 2024, copper markets are expected to experience a delicate balance between supply and demand, as production challenges in key producing countries such as Chile and Peru could impact the metal.
Meanwhile, global demand for this industrial metal continues to grow, driven by the ongoing expansion in advanced technology and renewable energy industries.
According to forecasts by many analysts, copper prices could range between $4.25 and $4.75 per pound before the end of 2024, with potential for higher increases if supply chain pressures continue or demand rises unexpectedly.
The industrial metal "copper" could reach new record levels, surpassing its all-time high of $5.16 per pound in May 2024, if Chinese authorities succeed in achieving strong economic recovery in the world's largest metals consumer.
About Copper Metal
Copper is a natural metal characterized by its reddish-orange color. It is one of the first metals used by humans thousands of years ago across various civilizations for making tools and weapons.
Copper is an extremely important industrial metal, widely used in numerous basic industries due to its unique properties, such as high electrical and thermal conductivity and resistance to corrosion.
Properties and Uses of Copper
- Excellent electrical conductivity: Copper is one of the best conductors of electricity, so it is primarily used in electrical wires and cables.
- Thermal conductivity: Used in manufacturing cooling pipes and thermal conditioning systems due to its efficient heat conduction.
- Malleability and flexibility: Copper is easily shaped, making it suitable for making tools and wires.
- Corrosion resistance: Copper's resistance to corrosion makes it ideal for applications requiring durability and longevity.
Main Industries Relying on Copper
- Electricity and Electronics: Copper is used in making electrical wires, conductors, and electronic components.
- Construction: Used in pipes and other architectural fixtures.
- Transportation: Used in making cars, trains, and even airplanes, especially in electric vehicles.
- Renewable Energy: Copper is used in manufacturing solar panels and wind turbines.
Overview of Copper Price
- The current copper price is around $4.35 per pound, near the 4-week low.
- Copper saw a 3.5% increase in Q3 of this year, marking the fourth consecutive quarterly gain due to global supply concerns.
- The copper price aims to trade above the key technical resistance at $4.7, with a target of reaching the $5 level by year-end or early next year.
Conversion from Pounds to Tons
| Metric Ton | Equals 1000 kg, primarily used in most countries. |
| 1 Metric Ton | = 2204.62 pounds |
| Weight in Metric Ton | = weight in pounds ÷ 2204.62 |
| Metric Ton Price | = price per pound × 2204.62 |
Factors Affecting Copper Prices
- Industrial demand growth: Copper is a key metal in industries such as construction, electronics, and manufacturing. Expanding investments in these sectors, especially in emerging countries, significantly increases copper demand.
- Renewable energy and electric vehicle sector growth: Renewable energy technologies like solar panels and wind turbines require significant amounts of copper, as do electric vehicles, which rely heavily on it for batteries and conductors. This rising demand pushes prices higher.
- Geopolitical and trade tensions: Crises or sanctions imposed on major copper-producing countries can reduce supply and increase prices.
- Production declines: Disruptions in major copper-producing countries like Chile and Peru can reduce output, leading to higher prices.
- Rising production costs: Increased costs of extracting and processing copper due to inflation and energy prices may drive producers to raise prices to compensate.
Global Copper Production
In 2024, global copper production faces challenges with moderate growth expectations compared to earlier forecasts.
In 2023, copper production reached approximately 22 million metric tons, with Chile as the largest producer globally, accounting for about 5.4 million metric tons per year, followed by Peru, producing around 2.5 million tons, then China, the Congo, and the United States.
Future projections indicate that global output will increase due to higher investments in new mines, especially in Africa and South America, along with the development of advanced mining technologies.
Global Copper Stocks
In 2024, global copper stocks reached notably low levels in major warehouses.
Data from the London Metal Exchange (LME) shows stocks around 125,000 tons, while the Shanghai Exchange reports approximately 60,000 tons, which is relatively low compared to previous years, raising concerns about market stability.
Copper Price Forecast for 2024
- Goldman Sachs: Expects copper prices to reach $5 per pound by the end of the year.
- Chilean Copper Commission "Cochilco": Expects copper prices to rise to $4.3 per pound by year-end.
- HSBC: Forecasts copper prices will reach $4.5 by the end of the year.
- World Bank: Forecasts the global copper market price to average $5 in 2024.
- ANZ Bank: Forecasts the global copper market price to reach around $4.75 per pound by the end of 2024.
Copper Investment Options
- Direct investment in copper futures:
- You can purchase copper futures contracts on commodity exchanges like the London Metal Exchange (LME) or the Chicago Mercantile Exchange (CME).
- This type of investment is risky as it requires understanding the market and price movements, in addition to having sufficient capital to cover margin requirements.
- Copper-related Exchange Traded Funds (ETFs):
- There are ETFs available that track copper prices, such as the United States Copper Index Fund (CPER).
- These funds offer the opportunity to invest in copper without needing to buy the physical metal, allowing investors to trade them like any other stock.
- Investing in copper mining companies' stocks:
- You can buy shares of major copper mining companies like Freeport-McMoRan and Southern Copper Corporation, which are leaders in this field.
- Investing in these companies gives indirect exposure to copper, as their profitability and financial performance are influenced by copper prices.
Investment Tips in Copper
- Portfolio Diversification: It is best to diversify investments between copper and other assets to reduce risks.
- Monitoring Global Markets: Copper prices are affected by economic events, especially industrial growth in countries like China and the United States.
- Market Analysis: Use technical and fundamental analysis to understand price movements in the long and short term.
Best Brokers for Copper Trading This Year
- Pepperstone - Best overall copper trading broker for beginners. Multiple regulated licenses. Founded 2010. Minimum deposit: $0. 20% discount on deposit.
- Plus500 - Best licensed broker for investing in copper. Multiple regulated licenses. Founded 2008. Minimum deposit: $100.
- XM - Top copper trading platform for educational materials and copy trading. Founded 2009. Multiple regulated licenses. Minimum deposit: $5. Periodic competitions and bonuses.

Technical Analysis of Copper Prices
Copper prices began an upward wave at the end of Q1 2020, reaching levels of $5.0346 before reversing downward in a corrective wave, reaching the 61.8% Fibonacci level, which formed strong support at $3.1376. Prices then rebounded upward, aiming to resume the long-term uptrend and setting new historical peaks at $5.1638.
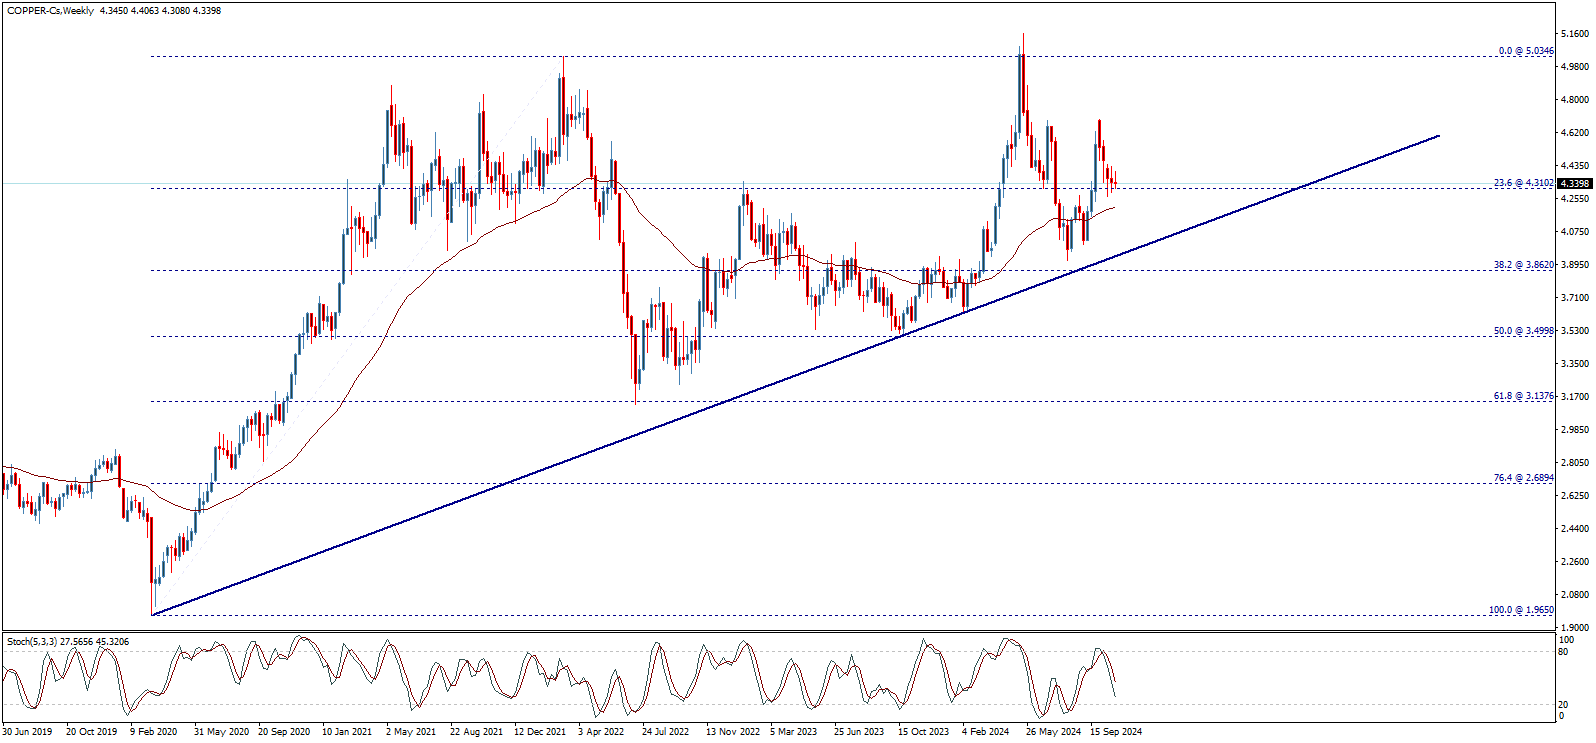
The price receives good positive support from the 50 moving average, while the Stochastic indicator is gaining positive momentum on long-term time frames, enhancing the chances of continuing the medium and long-term gains.
On the other hand, we observe that the price is moving within a symmetrical triangle pattern, which has a continuation nature. This means the price needs to break the resistance currently located at $4.5735 to add further confirmation of the expected upward trend.
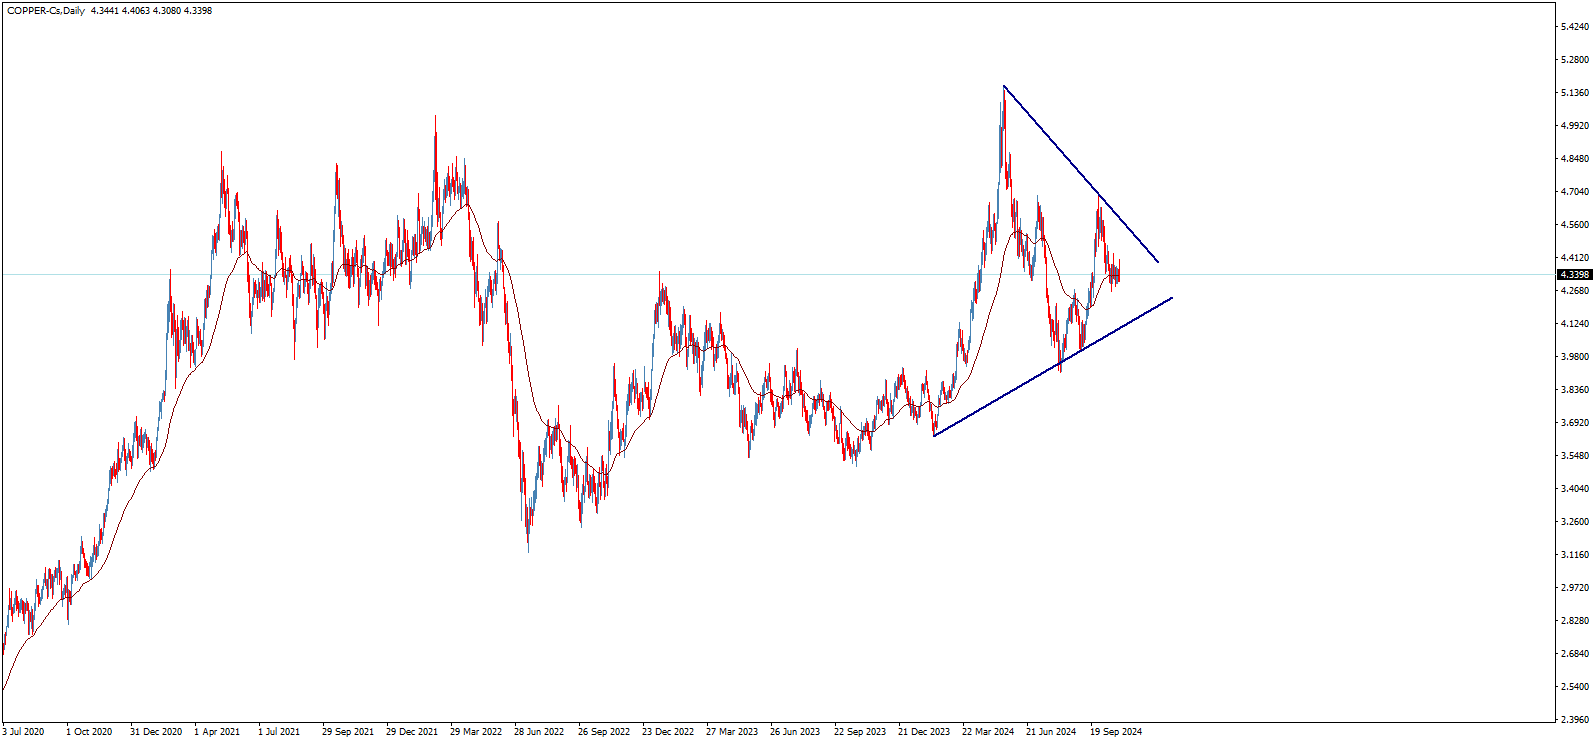
Closer examination on shorter time frames shows that the price is forming an inverted head and shoulders pattern, with the confirmation level at $4.6142. Breaking this level will be the strongest positive indicator for additional gains, potentially reaching new historic levels, with the next target around $5.9372.
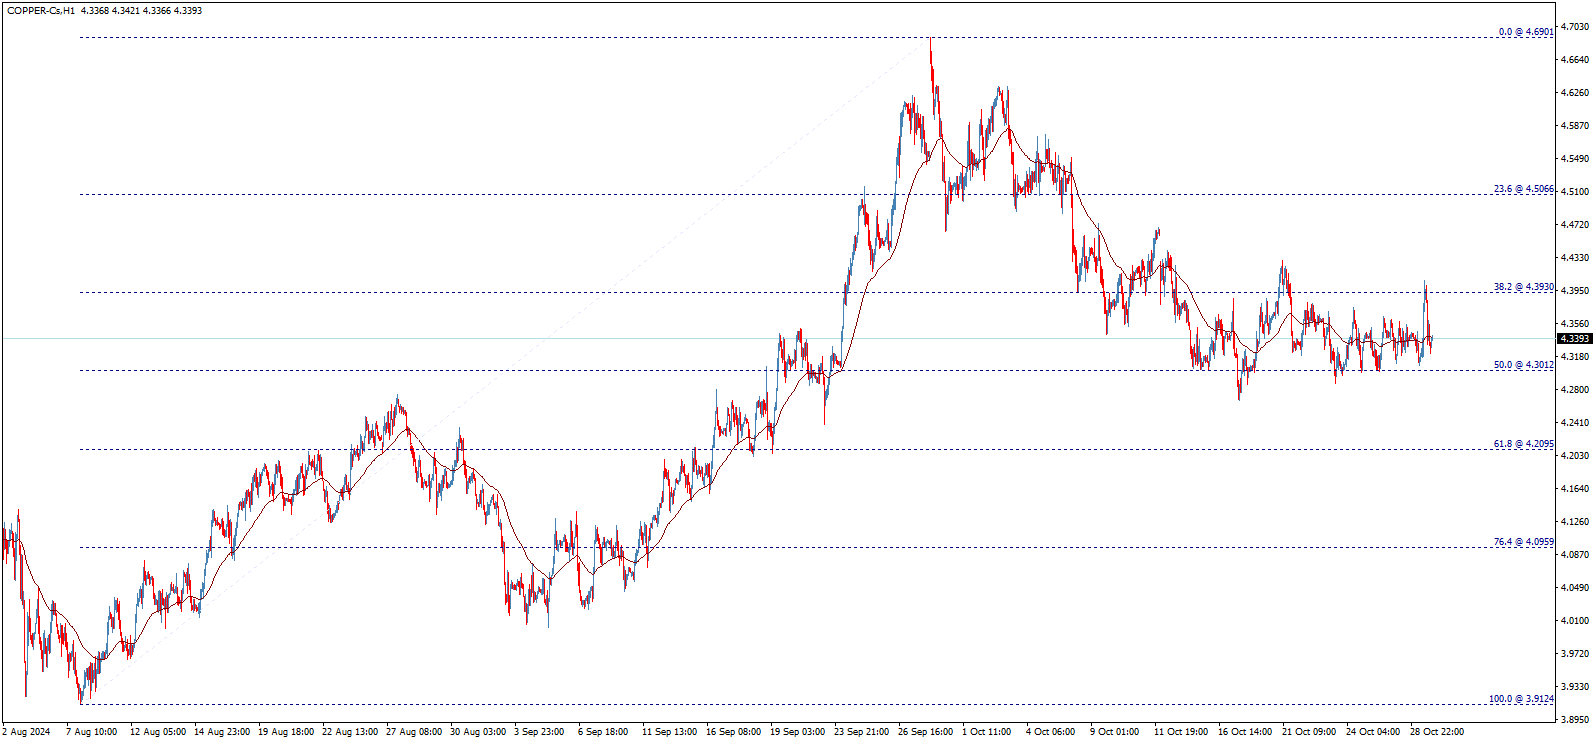
There is a possibility that the price may come under short-term corrective pressure, confirmed if the level at $4.3010 is broken. This could drive the price down to visit areas at $4.2095 and then $4.0960 before possibly resuming an upward move. Note that breaking $4.5066 would negate the proposed corrective decline and lead the price to continue rising without the suggested pullback.
In summary, the technical indicators suggest that copper is likely to continue its upward movement in the medium to long term, aiming for new positive targets reaching around $5.9372. However, it is important to watch for any potential break below $3.8620, as this would interrupt the expected uptrend and put the price under medium-term corrective pressure, with the next target around $3.5000. The price’s behavior at this level will be pivotal; holding above it could renew the upward trend, while a break lower could lead to further losses toward $3.1376.
Ethereum price (ETHUSD) begins negatively – Forecast today - 31-10-2024

Ethereum price (ETHUSD) begins today with clear negativity to press on 2664.30$ level, but we will depend on yesterday’s close above this level to continue suggesting the bullish trend for the upcoming period, waiting to resume the bullish wave that its next target reaches 2768.10$.
Therefore, we are waiting for positive trades in the upcoming sessions, taking into consideration that the continuation of the decline and breaking 2600.05$ will stop the bullish trend and put the price under the correctional bearish pressure again.
The expected trading range for today is between 2550.00$ support and 2770.00$ resistance.
Trend forecast: Bullish
Bitcoin price (BTCUSD) awaits more rise – Forecast today - 31-10-2024

Bitcoin price (BTCUSD) fluctuates within sideways track in the previous sessions, waiting to get positive motive that assist to push the price to resume the main bullish wave, which its targets begin by surpassing 73818.00$ to open the way to rally towards 76480.00$ as a next main station.
The EMA50 keeps supporting the suggested bullish wave, noting that breaking 71475.00$ will stop the expected rise and push the price to achieve some bearish correction on the intraday basis.
The expected trading range for today is between 71000.00$ support and 74500.00$ resistance.
Trend forecast: Bullish
Wheat price resumes the decline – Forecast today - 31-10-2024

Wheat price bounced bearishly after testing the intraday bearish channel’s resistance line that appears on the chart, which supports the continuation of the expected bearish trend on the intraday basis, waiting to test 568.50$ initially, reminding you that breaking it will push the price towards 555.60$ as a next main target.
The EMA50 supports the suggested bearish wave, which will remain valid unless the price rallied to breach 599.00$ and hold above it.
The expected trading range for today is between 568.00$ support and 586.00$ resistance.
Trend forecast: Bearish