Copper price shows more negative signals– Forecast today – 14-11-2025
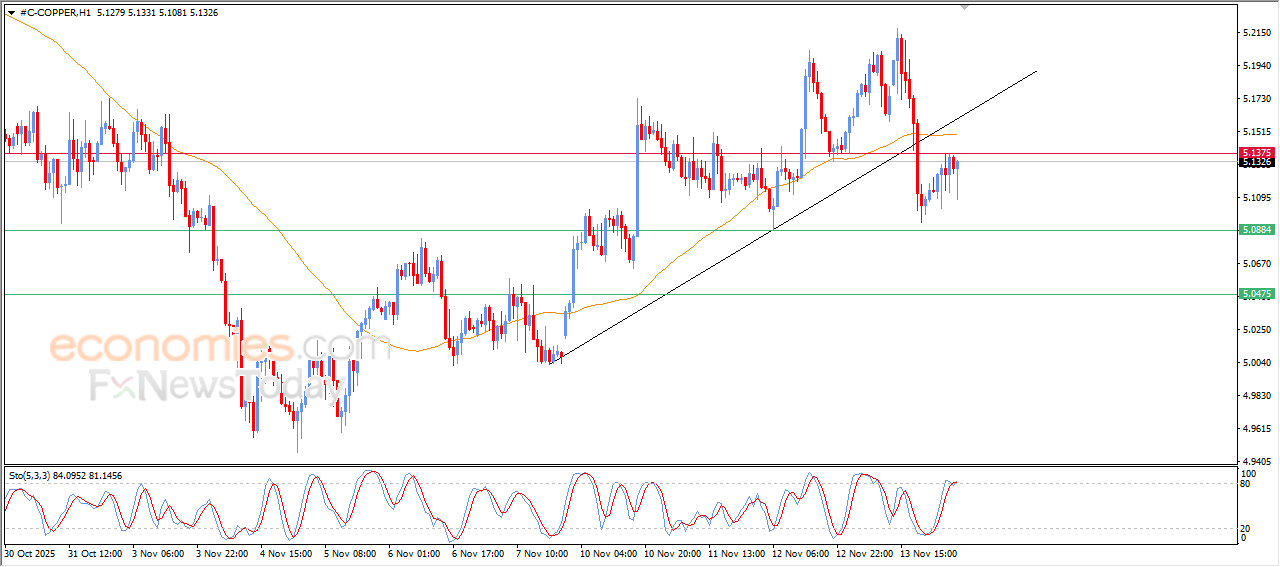
Copper price trading fluctuated in its last intraday trading, amid the dominance of bearish corrective wave on the short-term basis, affected by breaking minor bullish trendline, besides the continuation of the negative pressure due to its trading below EMA50, reducing the chance of the price recovery on the near-term basis, especially with the emergence of negative overlapping signals on the relative strength indicators, after reaching overbought levels, exaggeratedly compared to the price move, indicating the beginning of forming negative divergence, intensifying the negative pressure.
Therefore, our expectations suggest a decline in copper price’s upcoming intraday trading, especially if it settles below $5.1375, targeting the key support at $5.0885 and there are strong chances of breaking it.
The expected trading range for today is between $5.0885 and$5.1590
Trend forecast: Bearish
The (ETHUSD) is attempting to recover its losses- Analysis- 14-11-2025
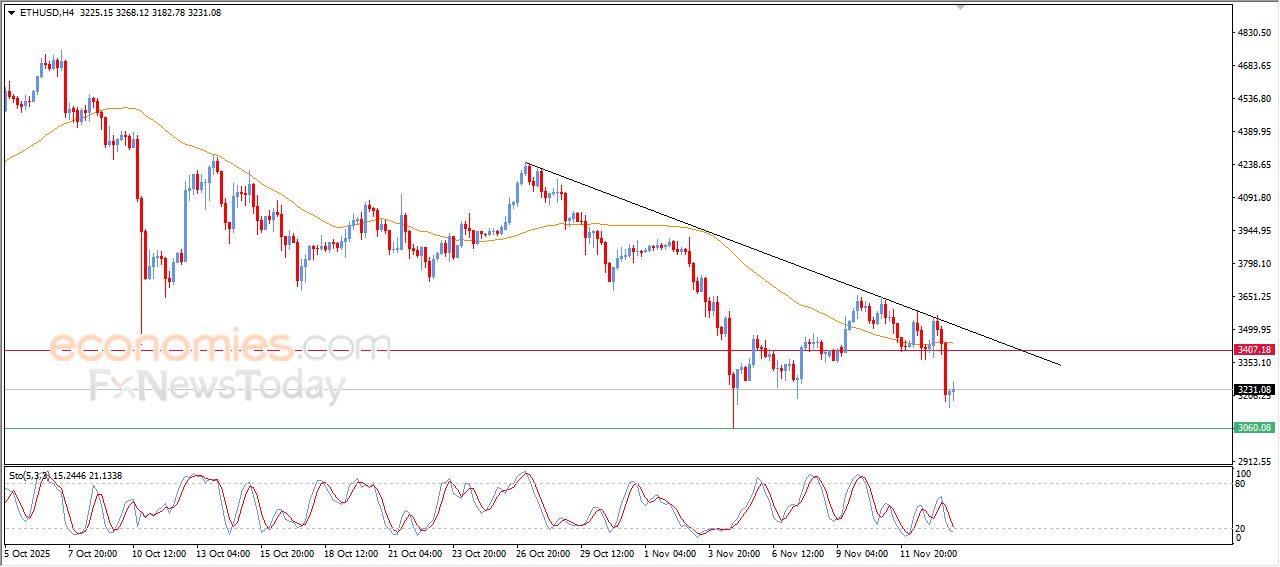
The (ETHUSD) price rose in its last intraday trading, to recover some of its previous losses, amid the continuation of the negative pressure due to its trading below EMA50, and under the dominance of the main bearish trend on the short-term basis and its trading alongside minor trendline on the short-term basis that supports this track, accompanied by the emergence of the negative signals on the relative strength indicators, despite reaching oversold levels.
Brent crude oil is getting rid of its negative pressure- Analysis-14-11-2025
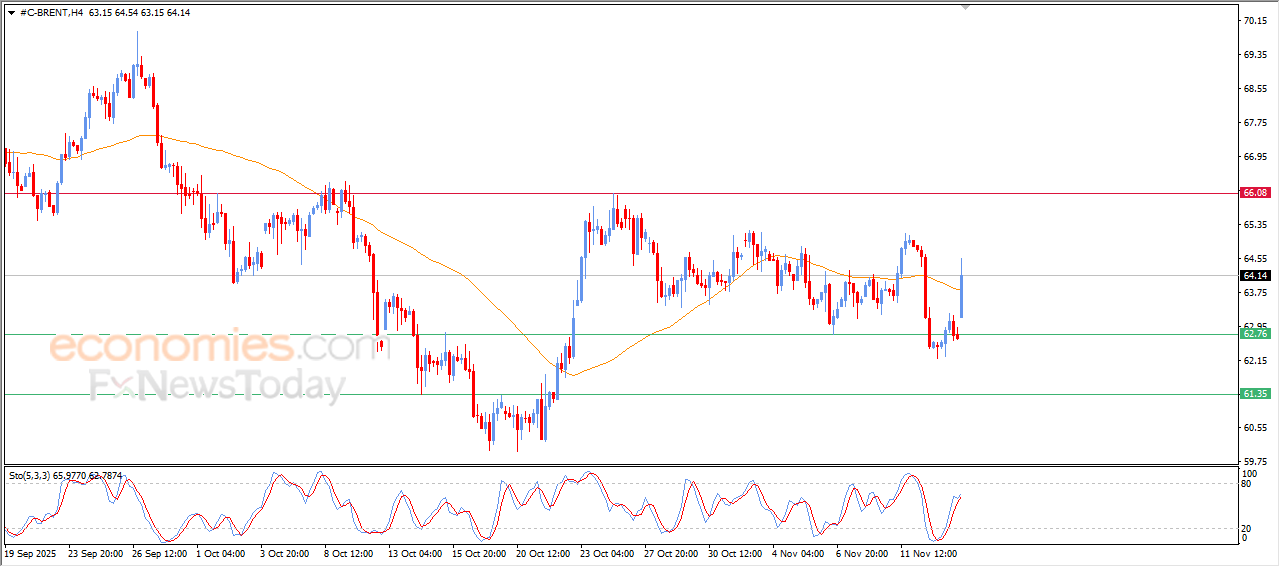
The (Brent) price surged high in its last intraday trading, surpassing the resistance of its EMA50, getting rid of its negative pressure to open the way for achieving more gains in the upcoming period, especially with the emergence of the positive signals on the relative strength indicators, providing chances for the stability of the bullish corrective trend on the short-term basis.
Silver price is getting ready to attack key resistance- Analysis-14-11-2025
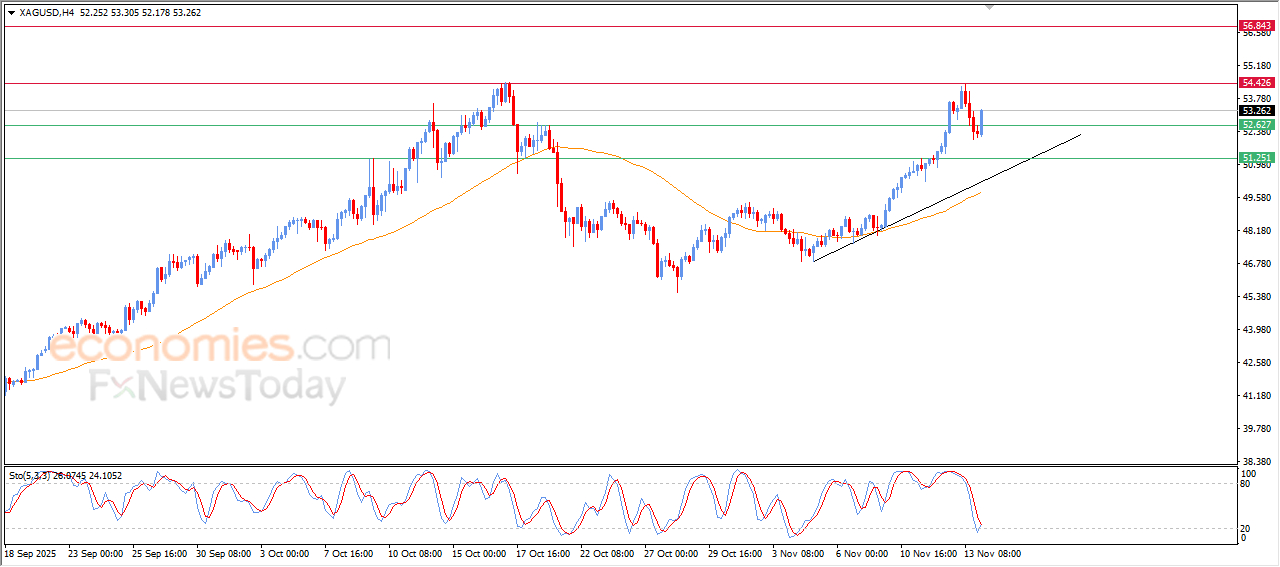
Silver price jumped higher in its last intraday trading, preparing to reach the key resistance at $54.40, amid the dominance of the main bullish trend and its trading alongside minor trendline on the short-term basis that supports this track, besides the emergence of positive overlapping signals on the relative strength indicators, after reaching oversold levels, exaggeratedly compared to the price move, indicating the beginning of forming positive divergence, which intensifies the bullish momentum.