Copper price declined slowly– Forecast today – 16-2-2026
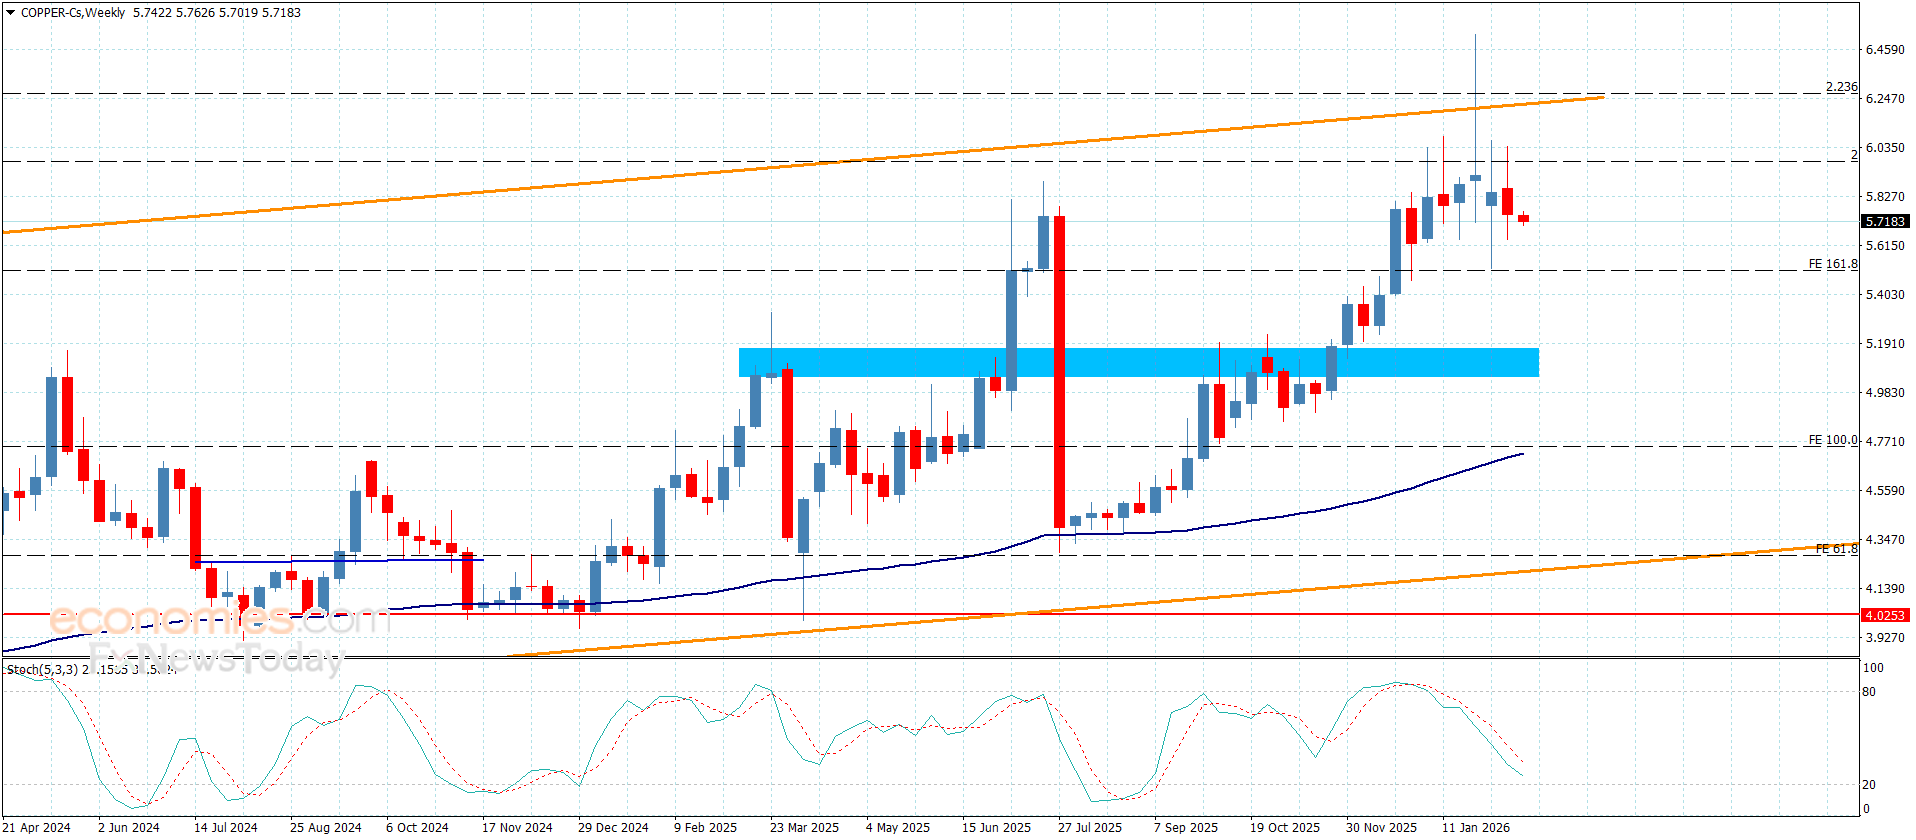
Copper price began this morning, activating with the negative factors that are represented by the stability of the barrier at $5.9700 besides the continuation of providing negative momentum, fluctuating near $5.7000 level.
We will keep our bearish corrective suggestion until facing extra support level at $5.5100, representing key for detecting the expected targets in the medium period trading
The expected trading range for today is between $5.5100 and $5.8500
Trend forecast: Bearish
The (ETHUSD) is amid negative expectations- Analysis- 16-02-2026
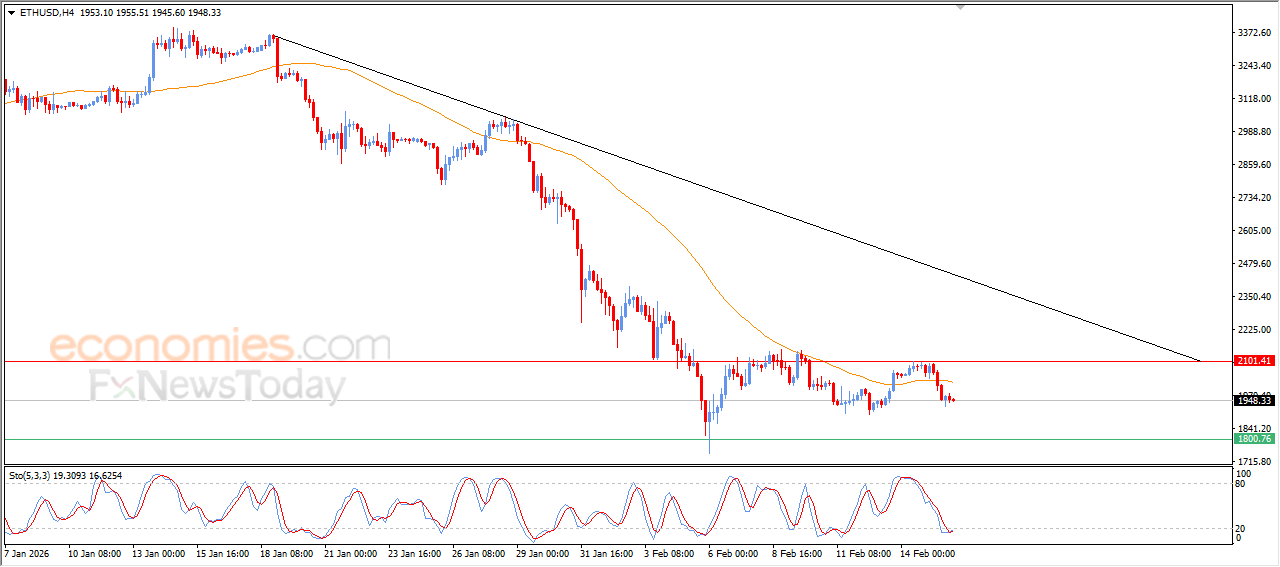
The (ETHUSD) price declined in its last intraday trading, with negative and dynamic pressure that is represented by its trading below EMA50, reinforcing the stability and dominance of the main bearish trend on short-term basis, on the other hand, we notice the emergence of positive overlapping signals on relative strength indicators, after reaching oversold levels, which might reduce the losses in the upcoming period.
Brent crude oil price gets ready to break its current support- Analysis- 16-02-2026
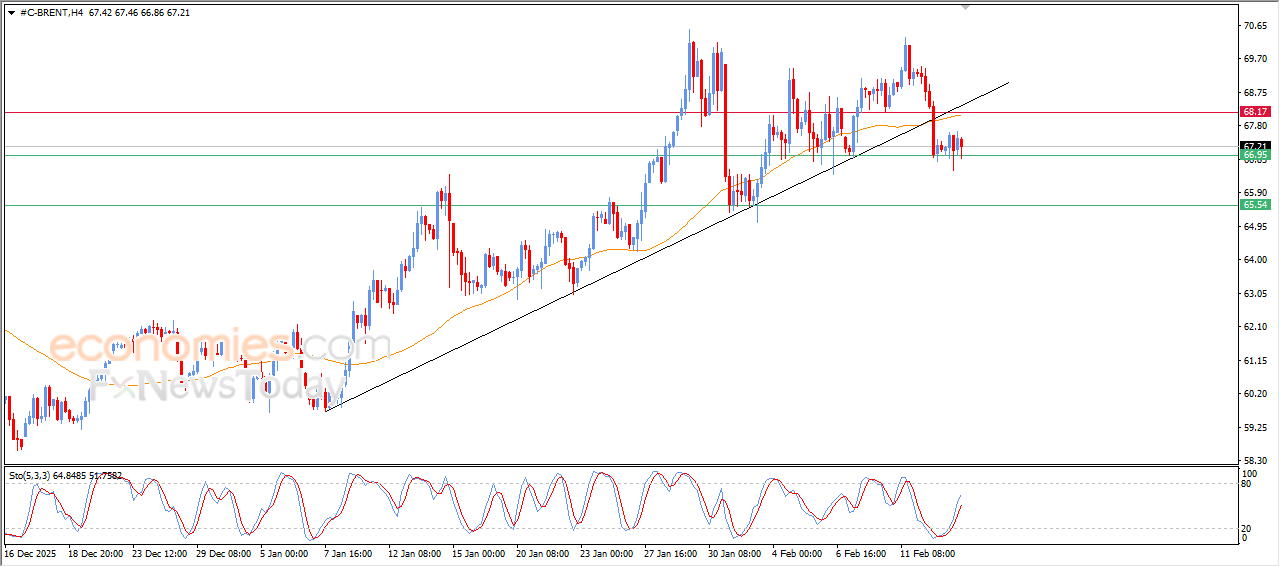
The (Brent) price declined in its last trading on intraday basis, amid the continuation of the negative pressure due to its trading below EMA50, intensifying the negative pressure especially after breaking main bullish trend line on the short-term basis, preparing to break $66.95 support, after offloading its oversold conditions on relative strength indicators, fading any bullish momentum.
The USDCHF Price is moving alongside main bearish trend line- Analysis-16-02-2026
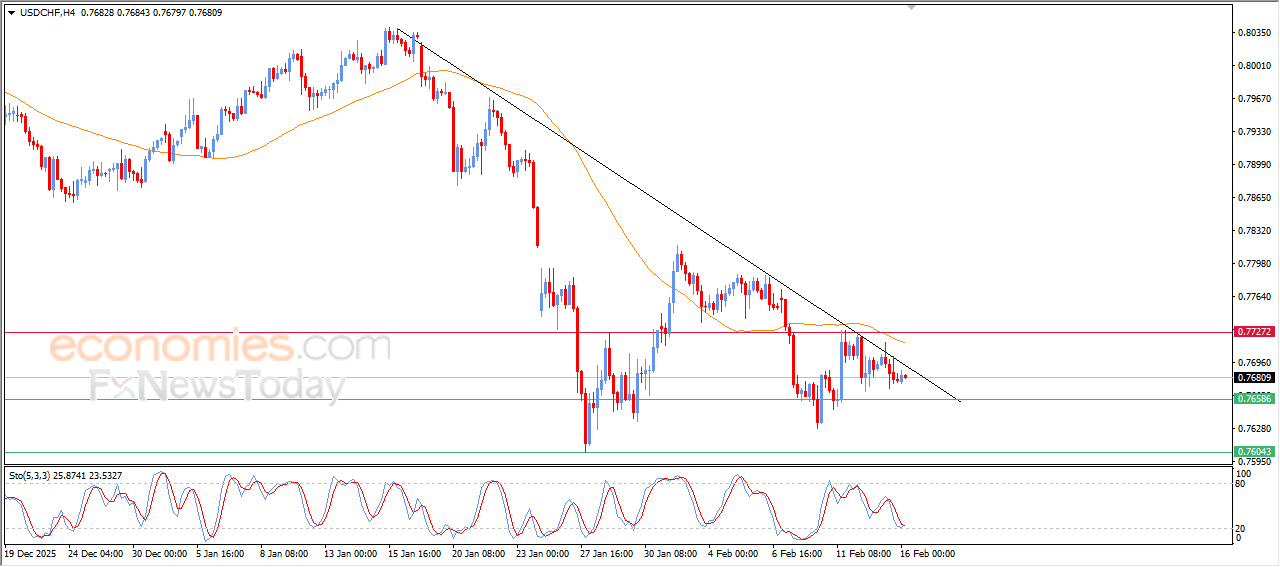
The (USDCHF) price settles in its last intraday trading, with the dominance of the main bearish trend on short-term basis, with its trading alongside supportive trend line for this path, besides the continuation of the dynamic and negative pressure that is represented by its trading below EMA50, with the emergence of the negative signals from relative indicators, despite reaching oversold levels.