Forecast update for Brent -27-03-2026
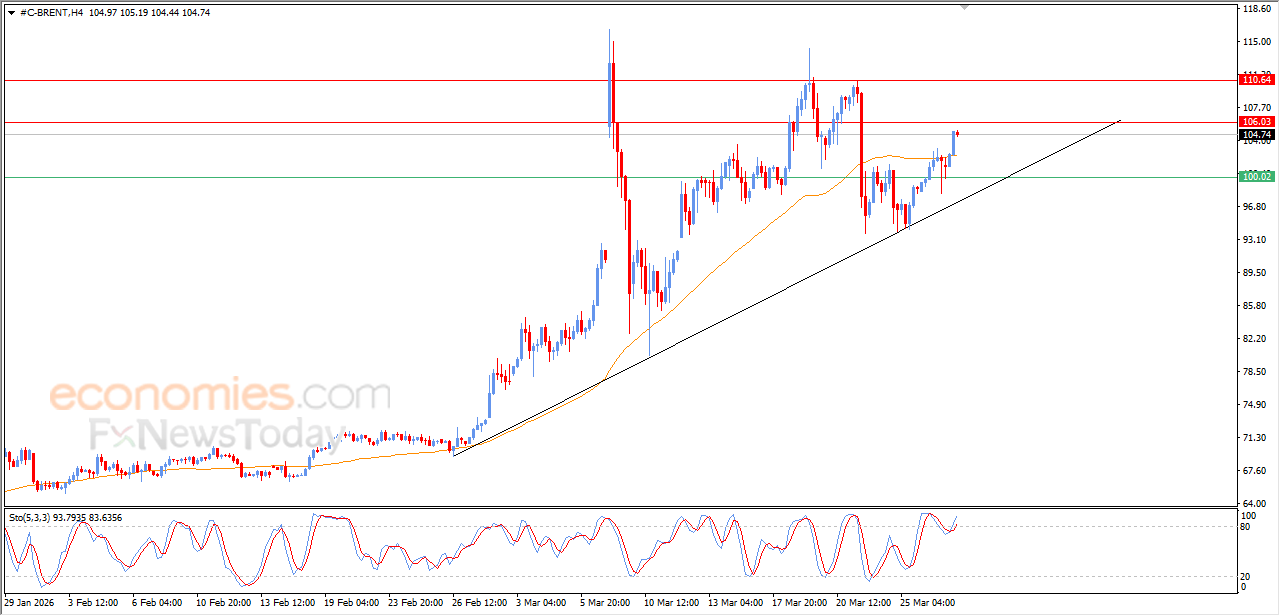
Brent crude oil (Brent) extended its strong gains in its recent intraday trading, amid the dominance of the main bullish trend on short-term basis, with its trading alongside supportive trend line for this path, to surpass the EMA50’s resistance, to surpass its negative pressure , taking advantage of offloading its overbought conditions on the relative strength indicators, providing more positive momentum, to expand these gains on the near-term basis.
Forecast update for Bitcoin -27-03-2026
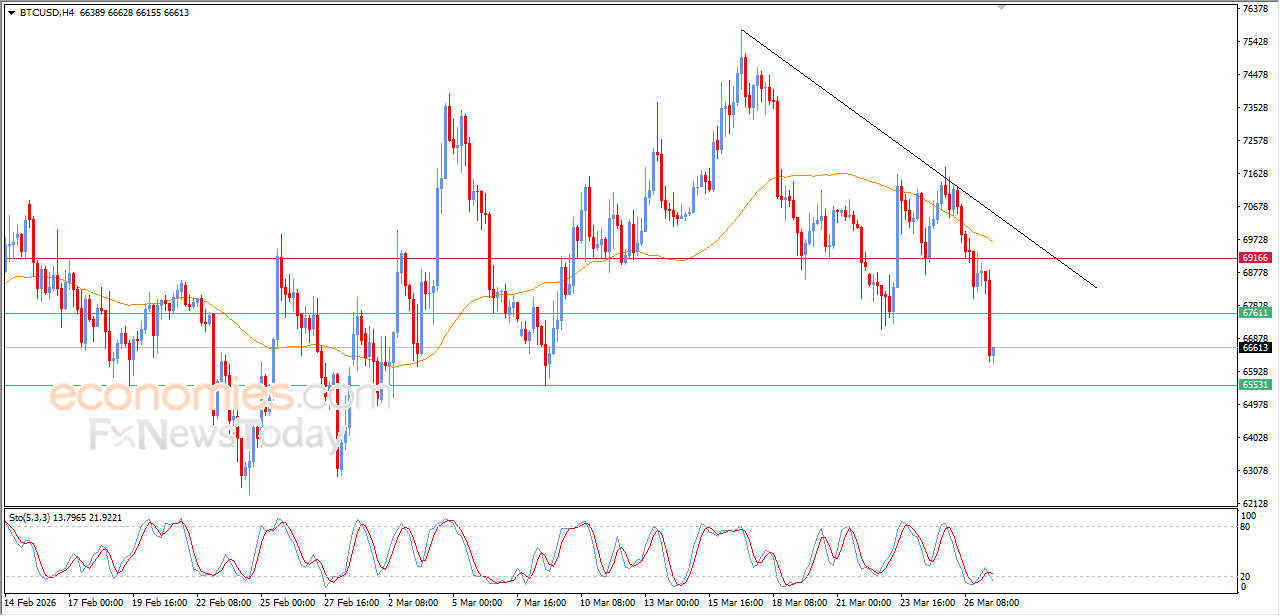
Bitcoin price (BTCUSD) slipped lower during its recent intraday trading, to break $67,500 support, which represented our expected target in our morning analysis for today, amid the continuation of the negative pressure due to its trading below EMA50, with the dominance of bearish corrective wave on short-term basis, and its trading alongside steep bearish trend line that indicates the strength of this path, noticing the return of the negative signals emergence from the relative strength indicators, after offloading its oversold conditions.
Forecast update for crude oil -27-03-2026
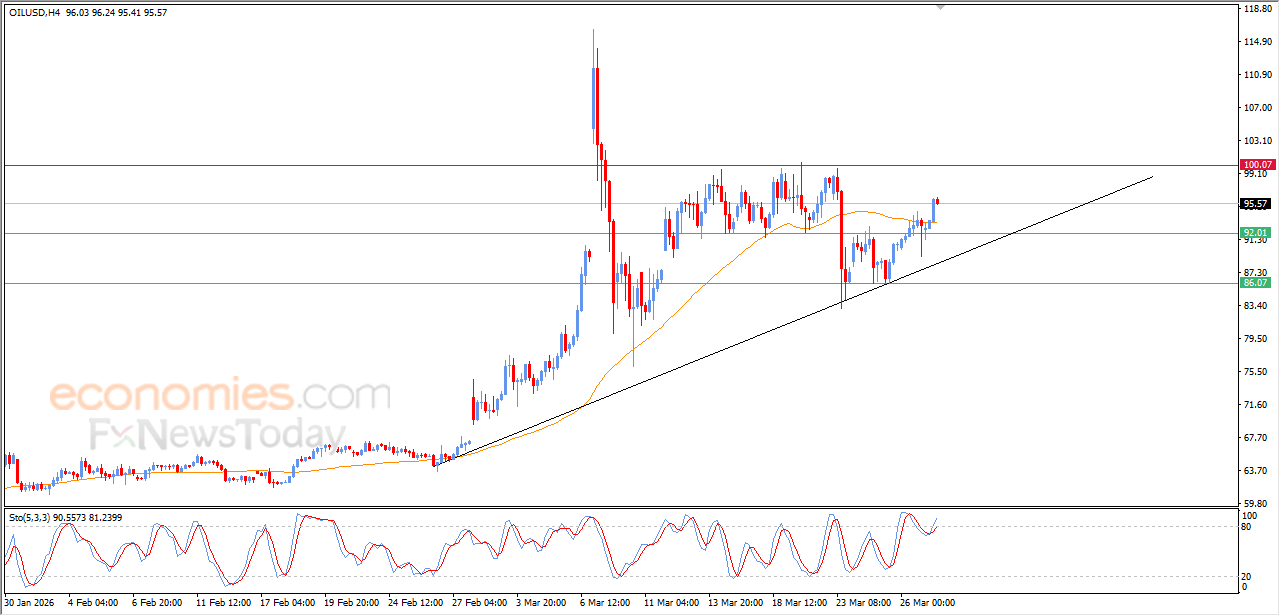
Crude oil price surged higher during its recent intraday trading, surpassing the negative pressure of the EMA50, announcing its full recovery amid the dominance of the main bullish trend on short-term basis, with its trading alongside supportive trend line for this track, noticing the emergence of the positive signals from the relative strength indicators, after offloading its overbought conditions from them, opening the way for targeting new resistance levels in the upcoming near period.
Forecast update for silver -27-03-2026
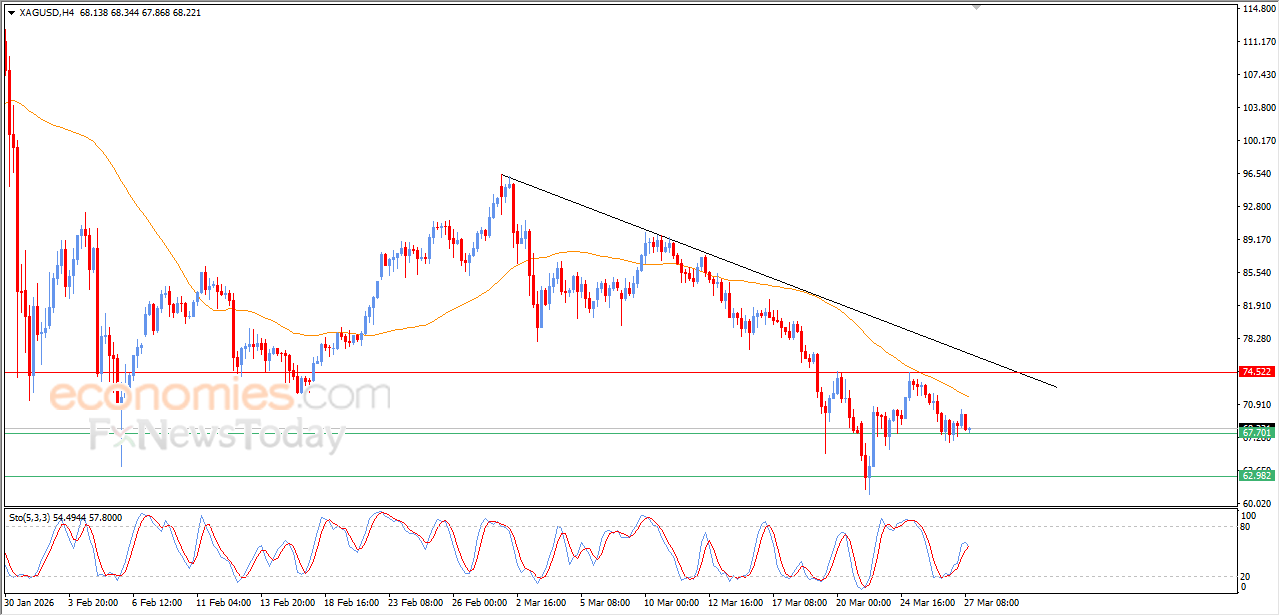
Silver price declined during recent intraday trading, amid the dominance of the short-term main bearish trend, with its trading alongside minor trend line that supports this path, with the emergence of negative overlapping signals from the relative strength indicators, after offloading its oversold conditions, preparing to break the current support level at $67.70, and this scenario supports the continuation of the trading below EMA50, representing dynamic resistance that intensifies the negative pressure around the price.