Forecast update for Brent -09-04-2026
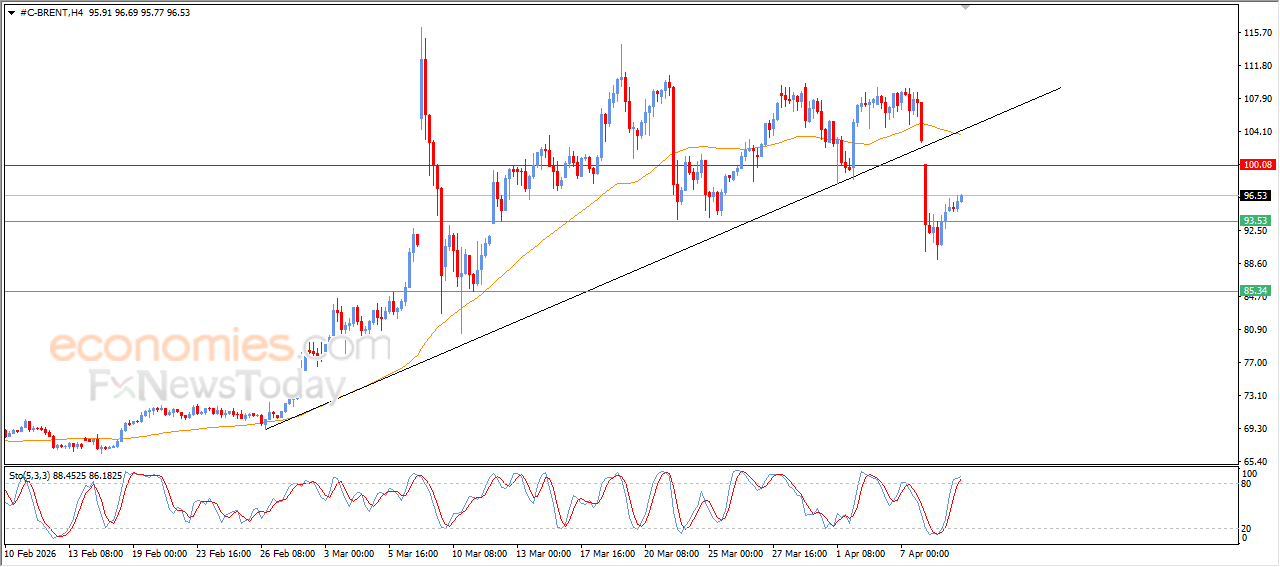
Brent crude oil prices rose during recent intraday trading, as they attempt to recover part of the previous losses. However, the price remains affected by an earlier break of a major short-term upward trendline, along with continued negative pressure from trading below the EMA50, which limits the chances of extending gains in the near term. Especially with the relative strength indicators reaching heavily overbought levels, exaggerated compared to the price movement, suggesting the beginning of a negative divergence along with the emergence of a negative crossover.
Forecast update for Bitcoin -09-04-2026
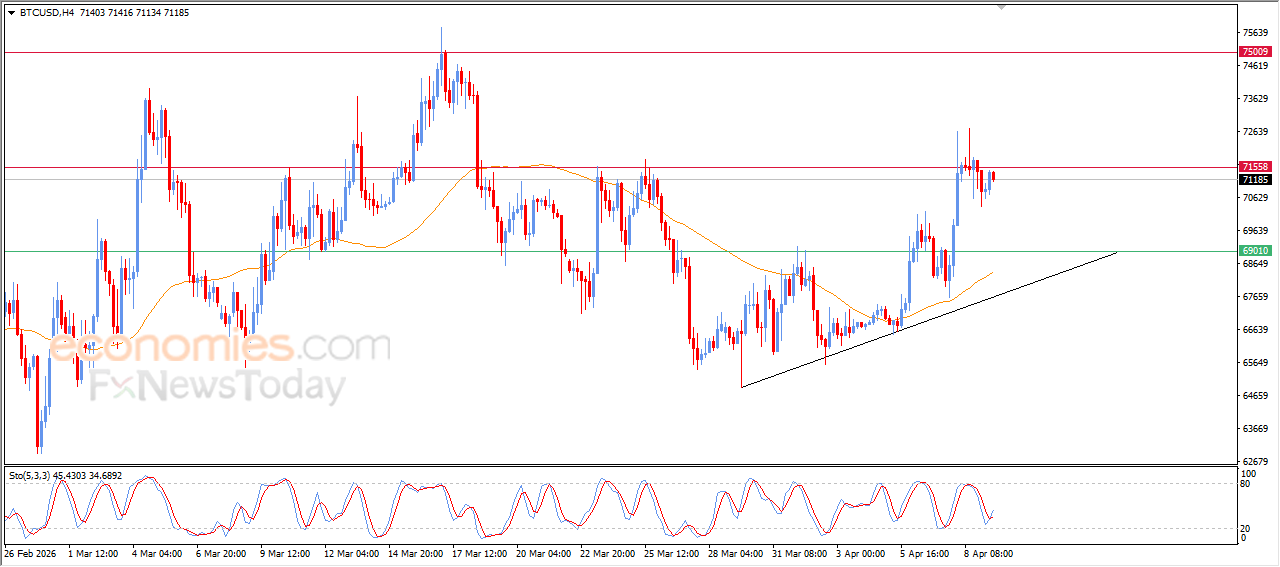
Bitcoin (BTCUSD) is holding onto gains during recent intraday trading, as it attempts to break through the strong resistance level at $71,500. This is supported by continued trading above EMA50, along with the dominance of a short-term minor bullish wave and movement alongside a trendline that enhances its stability.
However, in the background, we notice the beginning of negative signals from relative strength indicators after reaching heavily overbought levels.
Forecast update for crude oil -09-04-2026
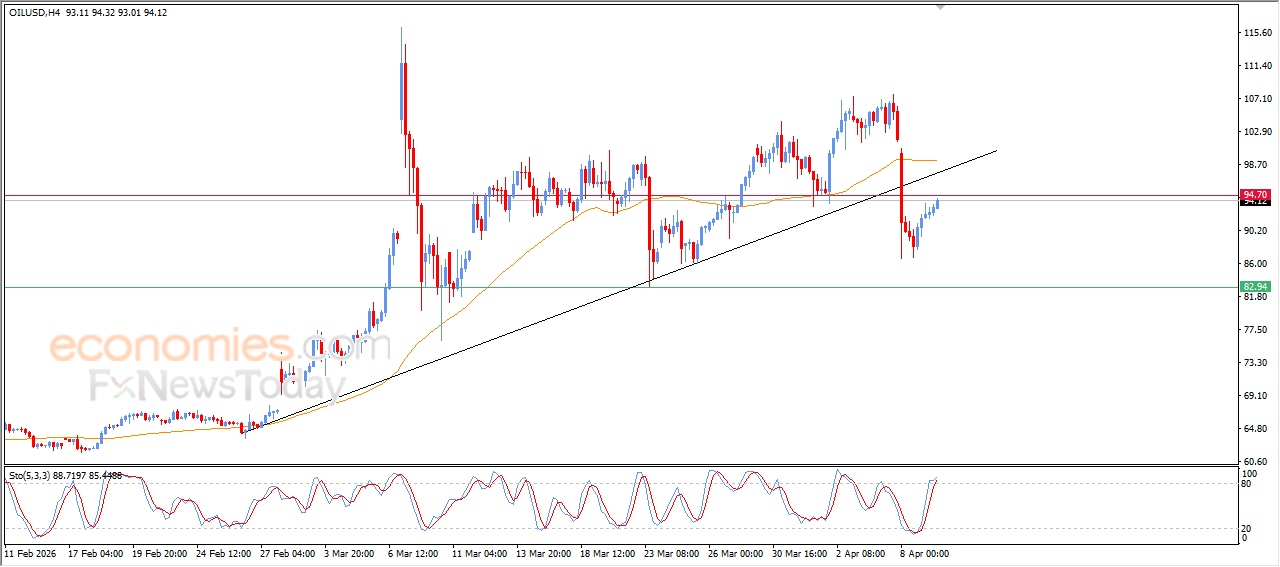
Crude oil prices extended their early gains during recent intraday trading, to retest the key resistance at $94.70, amid the dominance of bearish corrective wave, affected by breaking main bullish trend on the short-term basis, with a negative and dynamic pressure that is represented by its trading below EMA50, reducing the chances of full recovery on the near-term basis, especially with the relative strength indicators reaching overbought levels, exaggeratedly compared to the price move, with the emergence of negative overlapping signals, to indicate forming negative divergence that intensifies the negative pressure on the price.
Forecast update for silver -09-04-2026
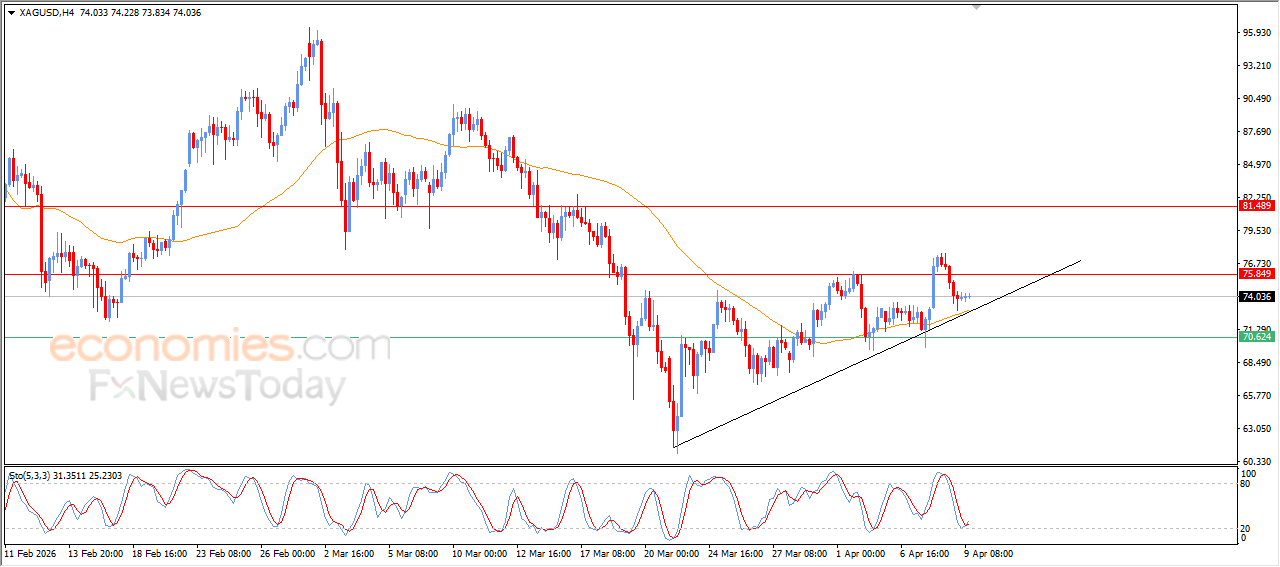
Silver witnessed sideways fluctuating trading in tight range during its recent intraday levels, amid the attempts of gaining bullish momentum that might help it to recover and rise again, supported by its trading above EMA50, reinforcing the stability and dominance of the bullish corrective trend on short-term basis, especially with its move alongside supportive trend line for this path, noticing the emergence of positive overlapping signals from the relative strength indicators, after reaching oversold levels, exaggeratedly compared to the price move, indicating the beginning of forming positive divergence.