Soybean price draws negative pattern – Analysis - 17-04-2023
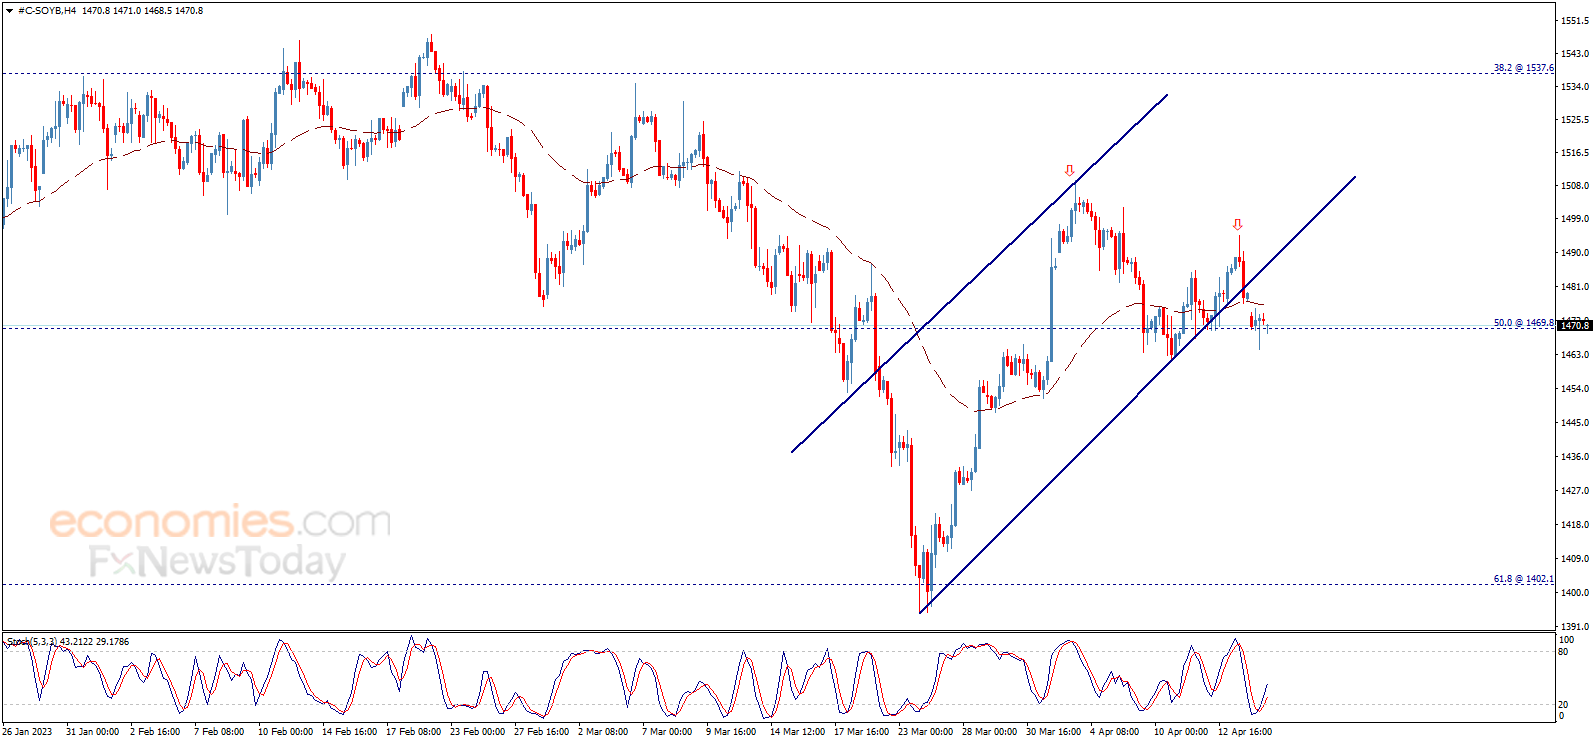
Soybean price fluctuates around 1470.00 support line and attempts to break it, and by taking a deeper look at the chart, we find that the price is forming double top pattern that its confirmation line located at 1463.00, which means that breaking this level will push the price to achieve negative targets that reach 1420.00 areas.
Therefore, we suggest witnessing negative trades in the upcoming sessions, supported by moving below the EMA50, noting that breaching 1476.00 followed by 1486.00 levels will stop the negative scenario and lead the price to return to the bullish channel again.
The expected trading range for today is between 1445.00 support and 1485.00 resistance.
The expected trend for today: Bearish
Corn price is recovering – Analysis - 17-04-2023
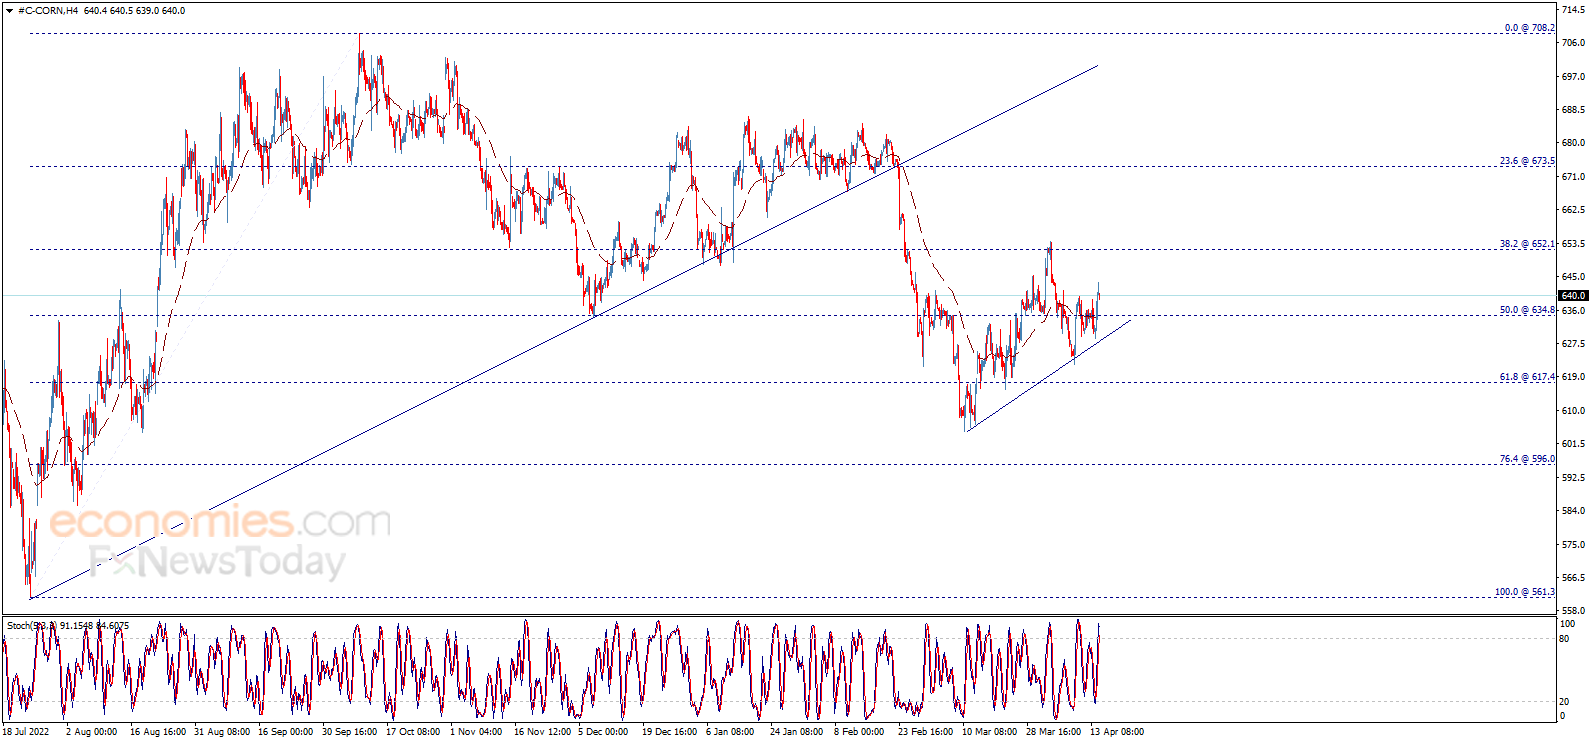
Corn price leaned on the intraday bullish trend line and bounced upwards to breach 634.80 and settles above it, to reactivate the positive scenario on the intraday basis and open the way to head to test 652.10 level as a next station.
Therefore, the bullish bias will be expected for today, supported by moving above the EMA50, noting that breaking 634.80 followed by 628.20 levels will stop the suggested rise and press on the price to return to the correctional bearish track again.
The expected trading range for today is between 632.00 support and 646.00 resistance.
The expected trend for today: Bullish
The USDCHF attempts to recover – Analysis - 17-04-2023

The USDCHF pair bounced upwards clearly to test the key resistance 0.8940 and settles around it, noticing that stochastic lost its positive momentum to show clear negative signals now, while the EMA50 continues to press negatively on the price.
Therefore, we believe that the chances valid to resume the main bearish trend, which its next target located at 0.8840, while breaching 0.8940 represents the key to achieve additional gains that reach 0.9070.
The expected trading range for today is between 0.8860 support and 0.9000 resistance.
The expected trend for today: Bearish
The NZDUSD fails to settle positively – Analysis - 17-04-2023

The NZDUSD pair declined strongly in the previous sessions after failing to consolidate above 0.6290 level, to hint the attempt to return to the correctional bearish track again, but it faces solid base at the bullish channel’s support line that appears on the chart, accompanied by witnessing positive signals through stochastic.
Therefore, the contradiction between the technical factors makes us prefer to stay aside until we get clearer signal for the next trend, noting that breaking 0.6200 will press on the price to achieve additional decline that targets 0.6140 areas initially, while consolidating above it represents the key to resume the bullish wave that its targets begin by testing 0.6290 again.
The expected trading range for today is between 0.6140 support and 0.6270 resistance
The expected trend for today: Neutral