


 |
|
USDJPY Breaks Minor Uptrend Line – Analysis – 25-05-2026
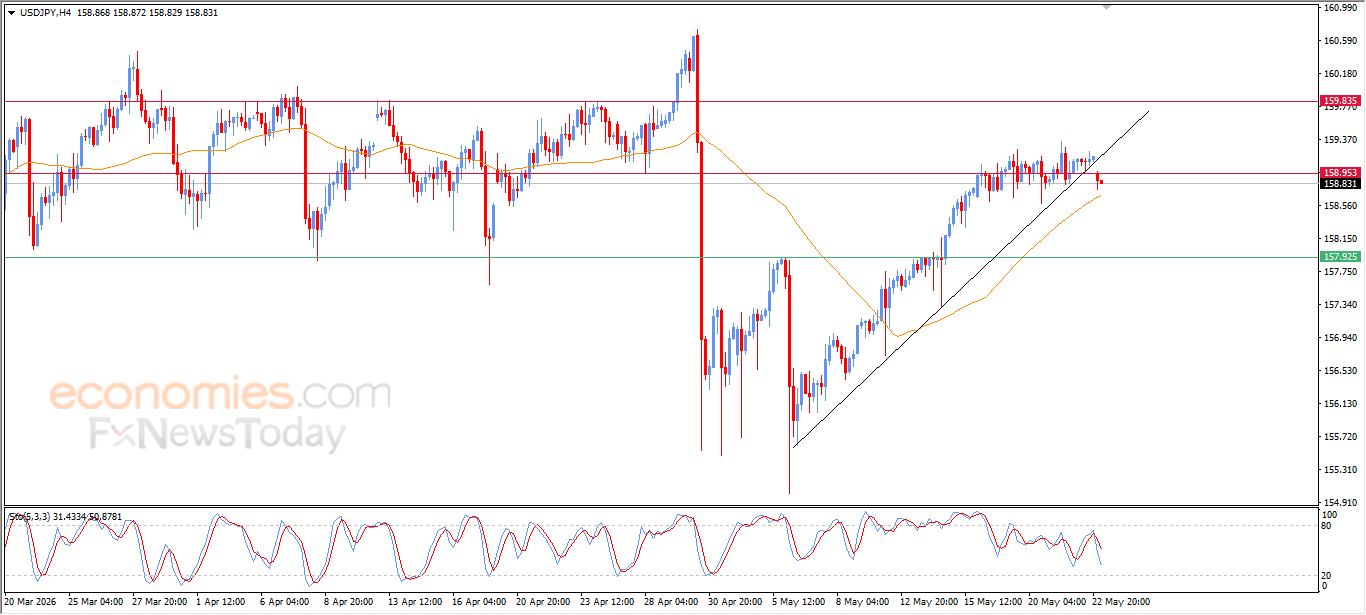
The (USDJPY) declined during its recent intraday trading, confirming the continued strength of the key resistance level at 159.00, breaking below a short-term minor bullish trend line, pressured by negative signals from the relative strength indicators after reaching overbought levels. The pair is now approaching support from its EMA50, in what may represent a final attempt to regain positive momentum and recover once again.
GBPUSD Breaks Key Resistance – Analysis – 25-05-2026
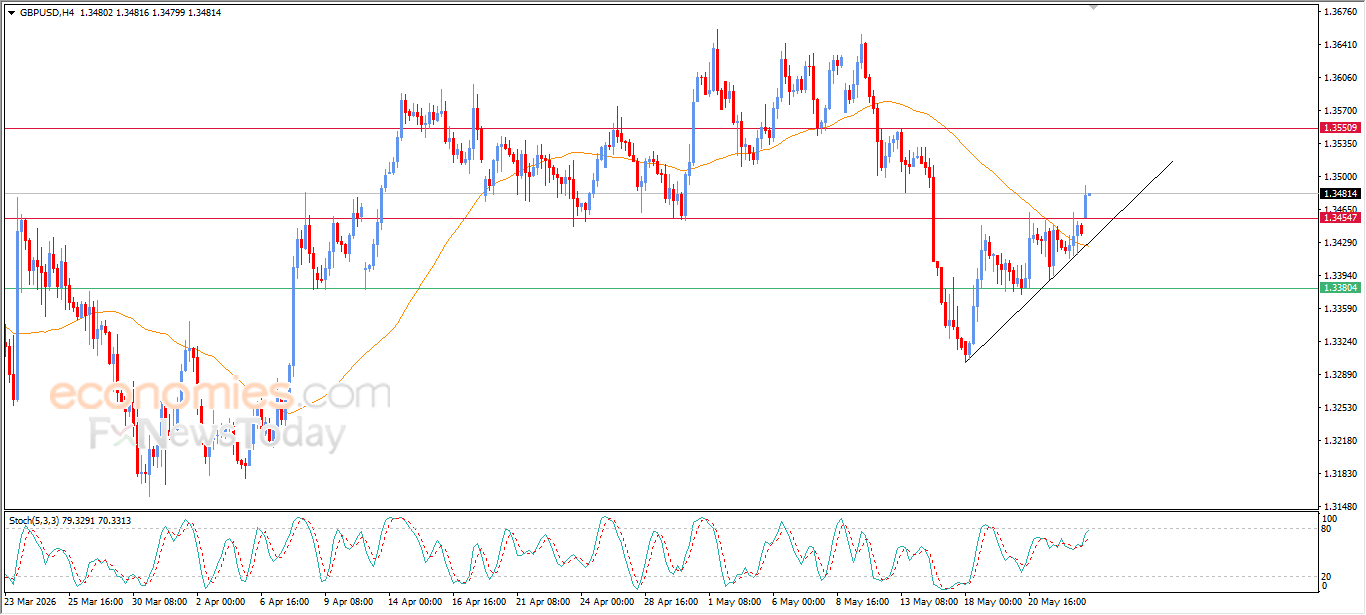
The (GBPUSD) moved higher during its recent intraday trading, with the pair breaking above the important resistance level at 1.3455. The move was supported by trading above its EMA50, which continues to provide dynamic support and strengthens the chances of extending gains in the near term. Additional support also comes from positive signals on the relative strength indicators, while the pair continues to trade along a sharply rising minor trend line that reflects the strength of the bullish momentum.
MoreBitcoin Price Gains Fresh Momentum as Technical Indicators Improve – Analysis – 25-05-2026
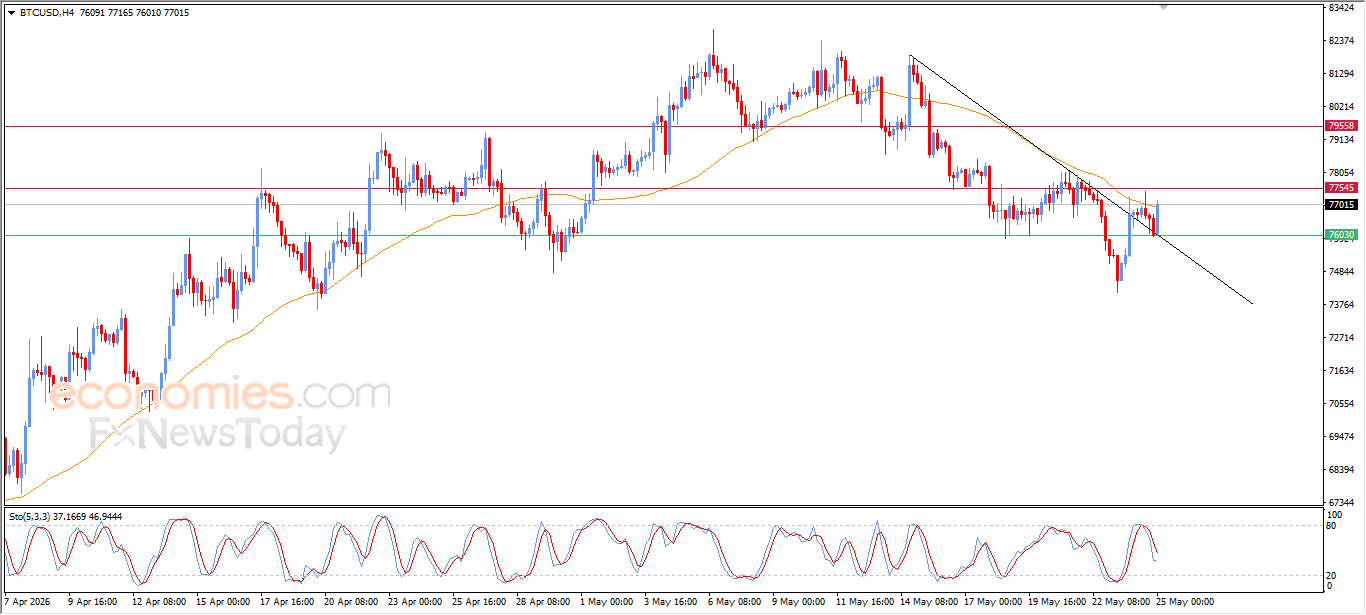
Bitcoin (BTCUSD) rose during its recent intraday trading after retesting a corrective bearish trend line that had been broken earlier, a technical signal supporting the continuation of recovery and the return of positive momentum. The price is attempting to overcome the negative pressure caused by its EMA50, which still acts as an influential dynamic resistance.
MoreCrude Oil Price Breaks Our Target Level – Analysis – 25-05-2026
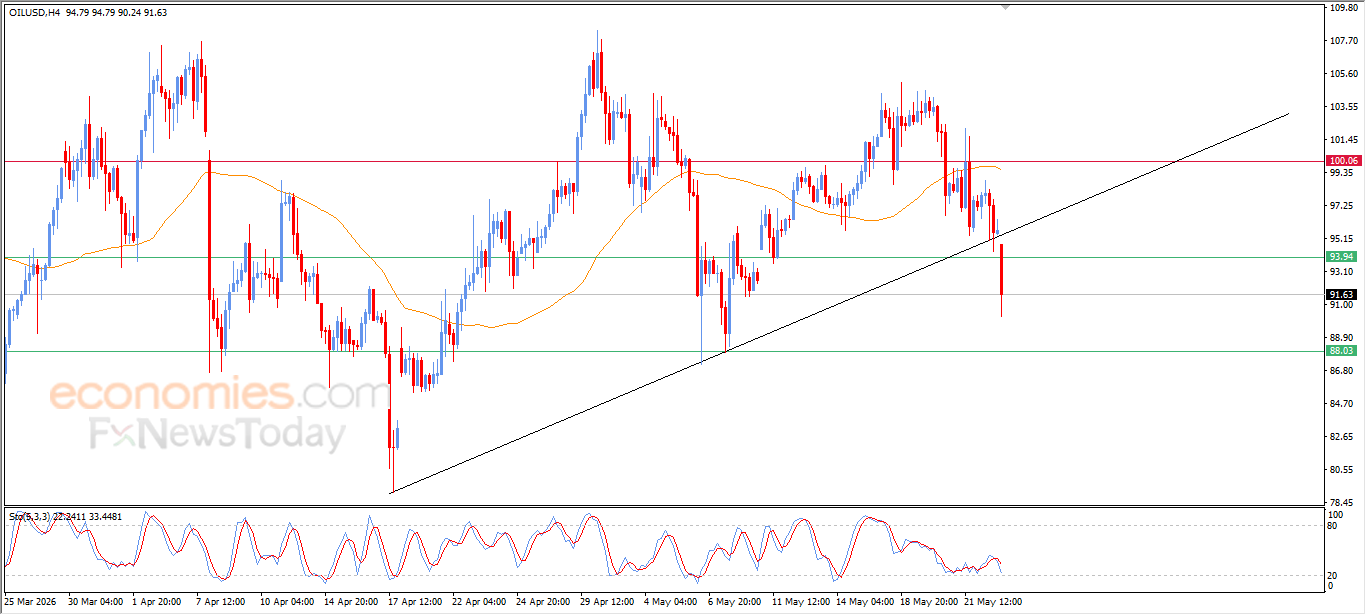
Crude Oil slipped lower during its recent intraday trading, under continued negative pressure from trading below its EMA50, which strengthened bearish momentum, leading to a break below a major short-term bullish trend line, a negative technical signal that increased the likelihood of further losses. The drop then extended to break 94.00$ support, which represented our downside target.
More