


 |
The USDJPY keeps recording the historical highs – Analysis - 20-10-2022
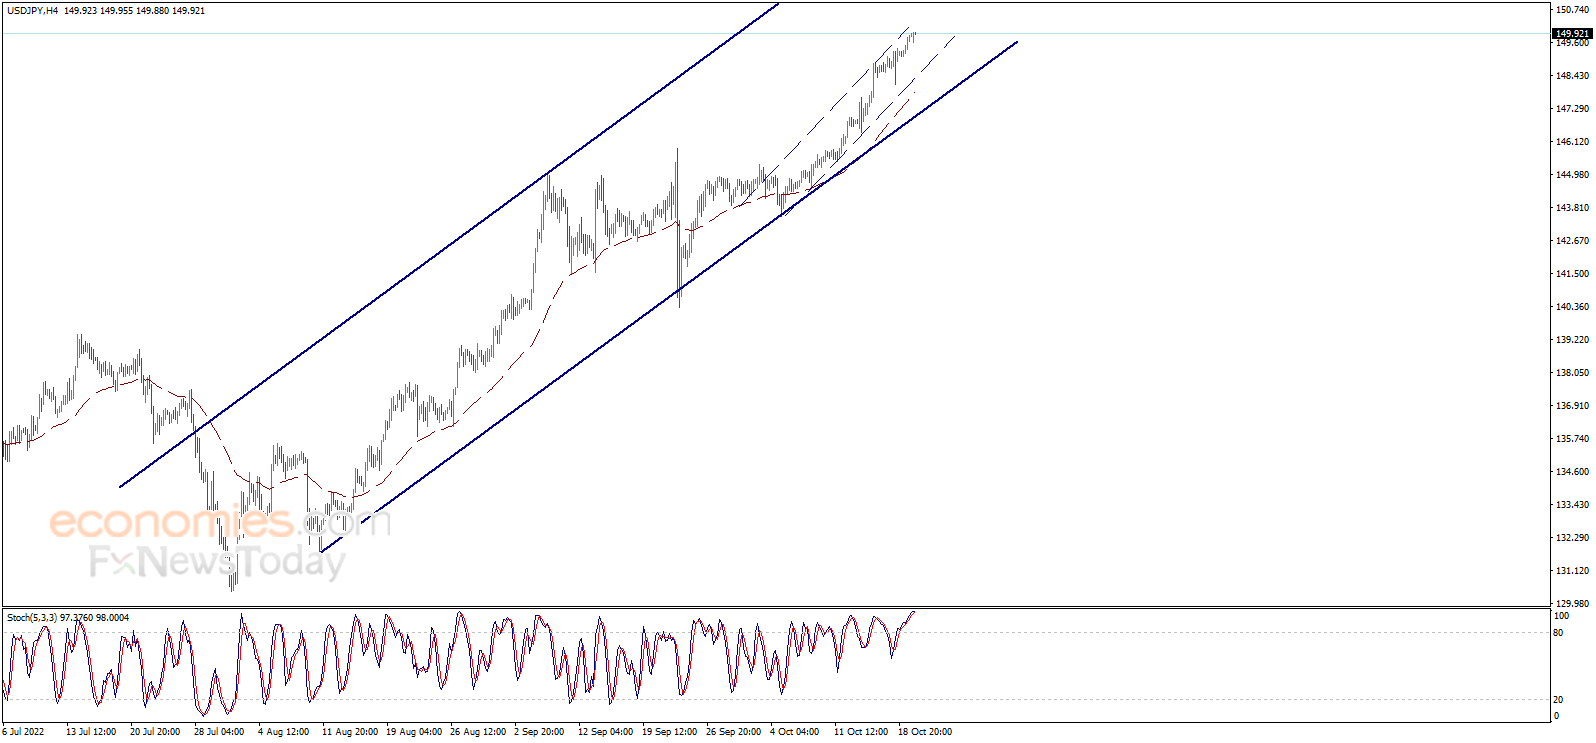
The USDJPY pair keeps rising to reach 150.00 barrier, and continues to record new historical levels, organized inside the bullish channels that support the chances of achieving more rise in the upcoming sessions, to head towards 151.30 areas as a next main station.
Therefore, the bullish trend scenario will remain active on the short term and medium term basis, noting that breaking 149.15 might push the price to achieve some bearish correction before turning back to rise. Again.
The expected trading range for today is between 149.15 support and 150.70 resistance
The expected trend for today: Bullish
Join Economies Discord channel to discuss this analysis
Thanks for your feedback.
The GBPUSD exits the bullish channel - Analysis - 20-10-2022
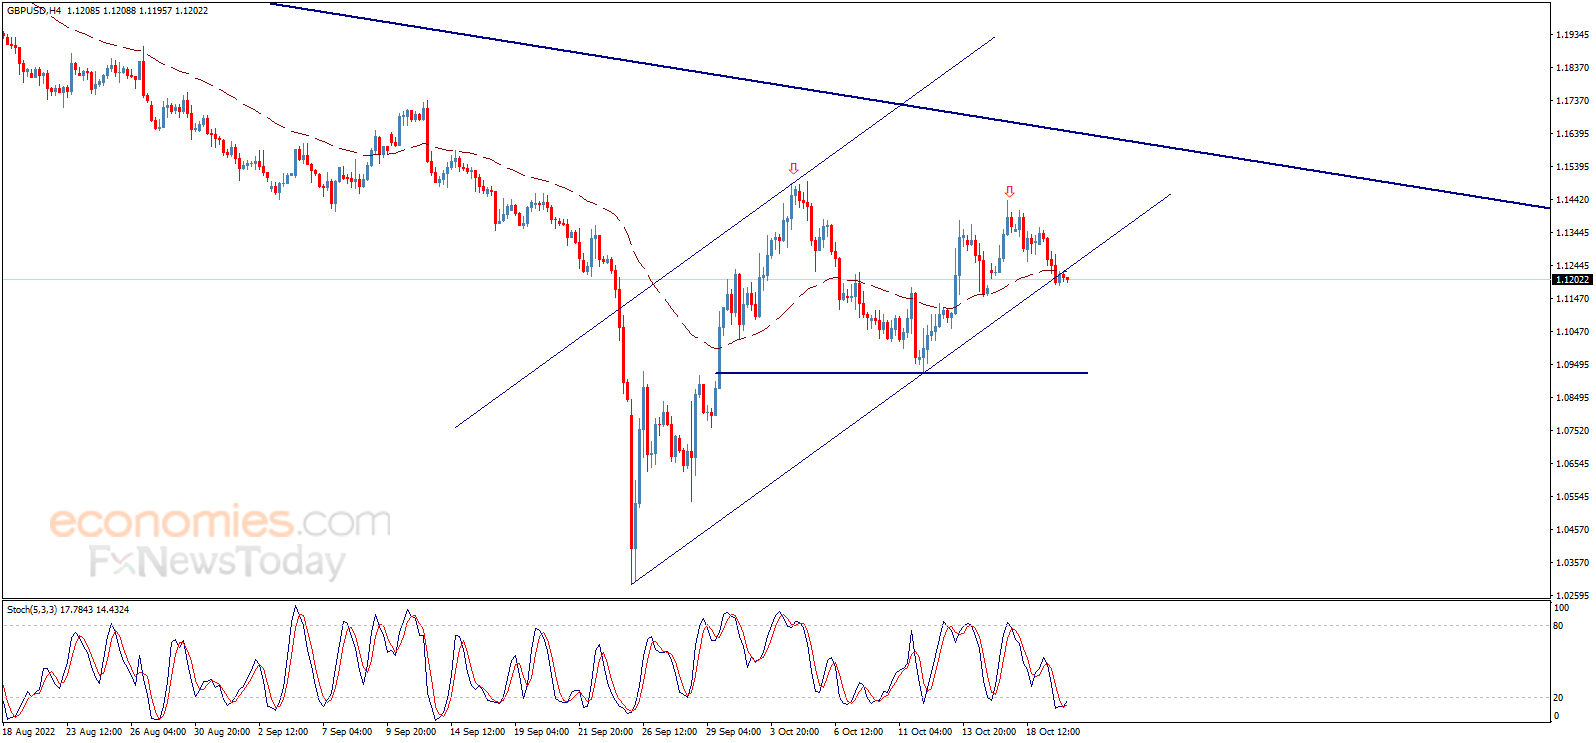
The GBPUSD pair provided more negative trades yesterday to break the bullish channel’s support line and settles below it, which puts the price under expected negative pressure on the intraday and short term basis, on its way to visit 1.1055 followed by 1.0920 areas.
MoreThe EURUSD under the negative pressure – Analysis - 20-10-2022
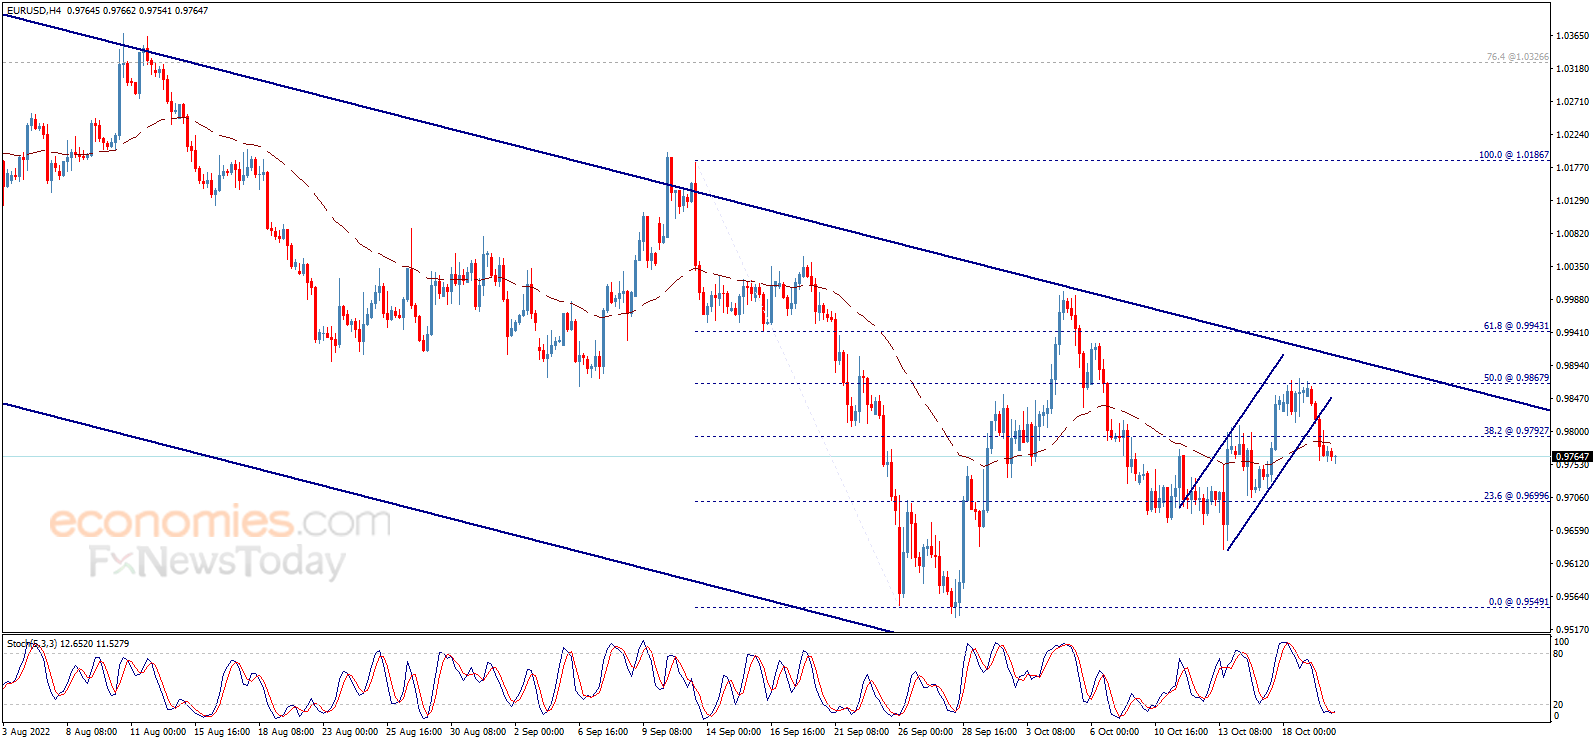
The EURUSD pair faced clear negative pressure yesterday to break 0.9790 level and close the daily candlestick below it, which pushes the price to trade with expected negativity in the upcoming sessions, especially after exiting the intraday bullish channel that appears on the chart, to head towards achieving negative targets that start at 0.9700 and extend to 0.9630 after surpassing the previous level.
MoreMcDonald's tests downward correctional trend line - Analysis - 19-10-2022
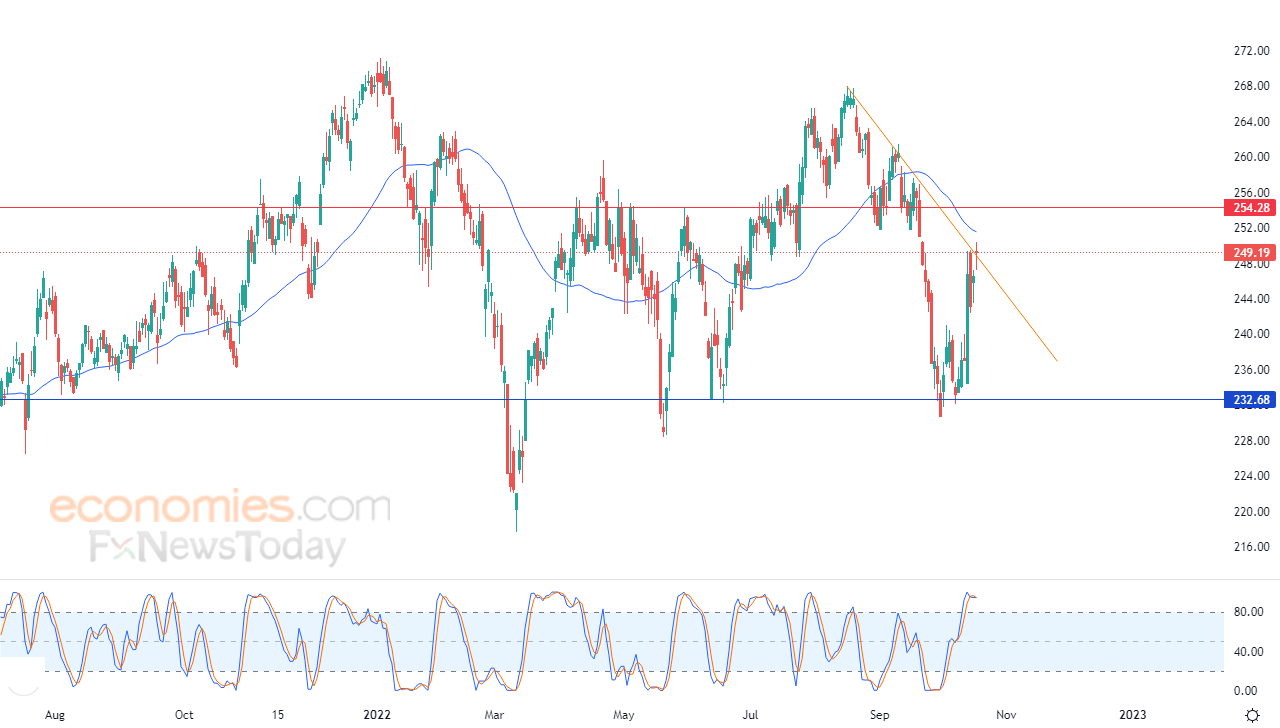
McDonald's stock (MCD) rose in the intraday levels, testing the resistance of the downward correctional short-term trend line, while touching the resistance of the 50-day SMA, amid negative signals out of the RSI after reaching overbought levels compared to the stock's movements, hinting at negative divergence.
More