


 |
|
USDCHF Exhausted Its Positive Opportunities – Analysis – 30-07-2026
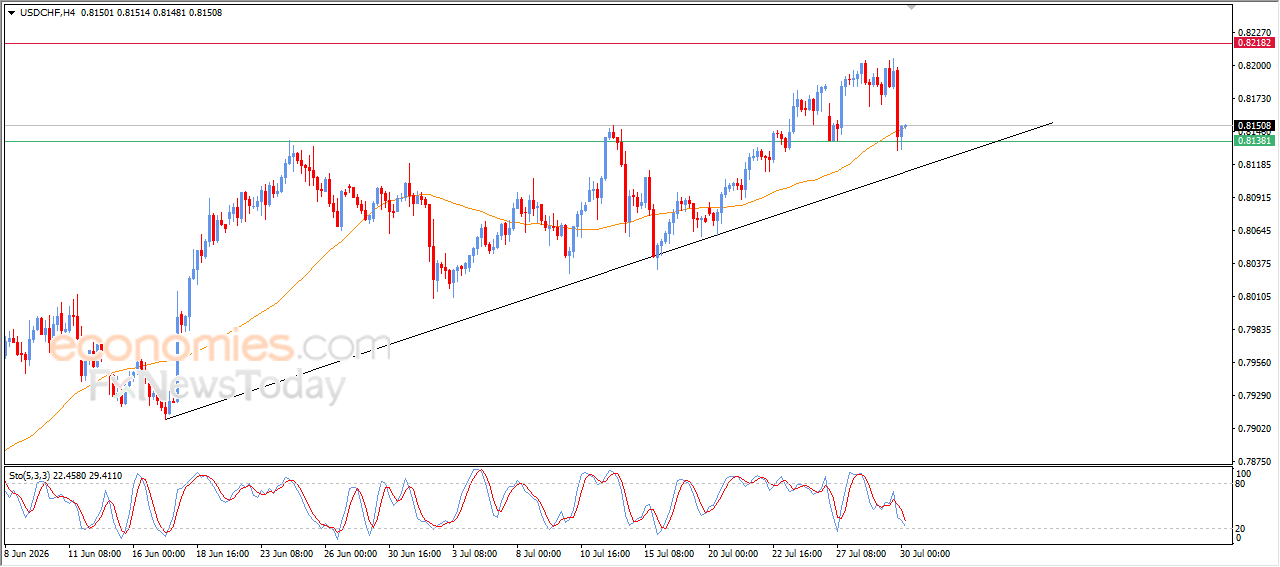
The USDCHF pair settled with sharp losses in its last intraday trading, amid the emergence of the negative signals from the relative strength indicators, attempting to look for a higher low to use it as a base that might help it gain the required bullish momentum for its recovery, leaning on EMA50’s support, which helped it to stop the losses, amid the dominance of the main bullish trend on the short-term basis, with its trading alongside supportive trend line for this path.
NZDUSD Price is Clinging to the Bullish Trend – Analysis – 30-07-2026
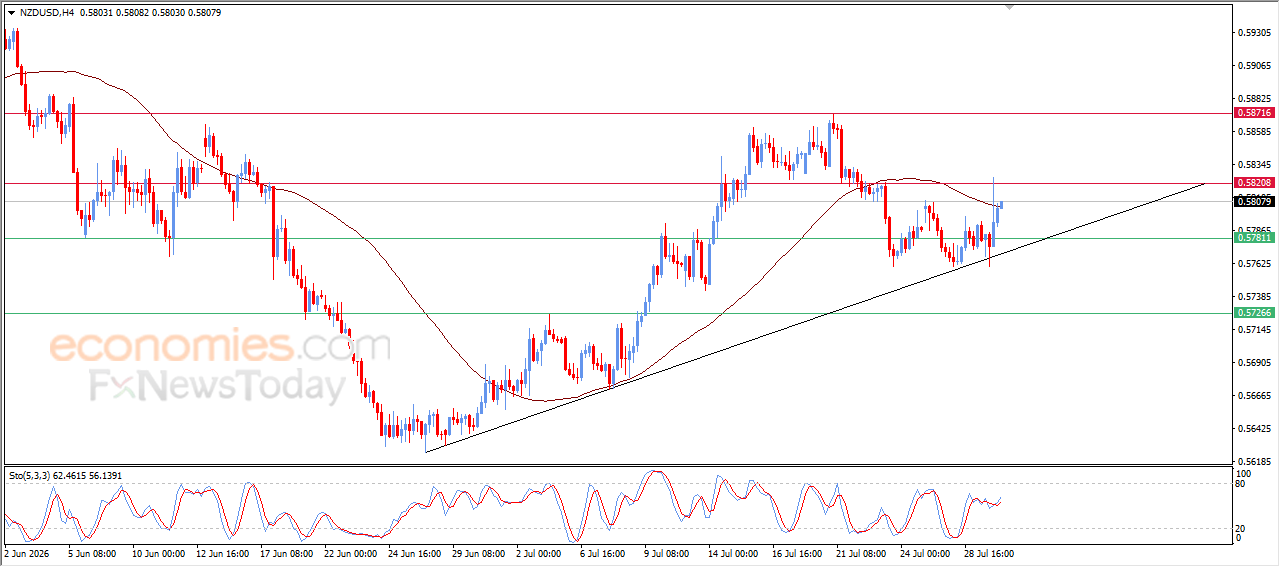
(NZDUSD) extended its gains during its latest intraday trading, supported by the bullish trend line on the short-term basis, gaining bullish momentum that helped it achieve these gains, attempting to get rid of the negative pressure of EMA50, to announce its full recovery, especially with the emergence of the positive signals from the relative strength indicators, to reinforce achieving this scenario.
MoreAUDUSD Price is Retesting Key Resistance – Analysis – 30-07-2026
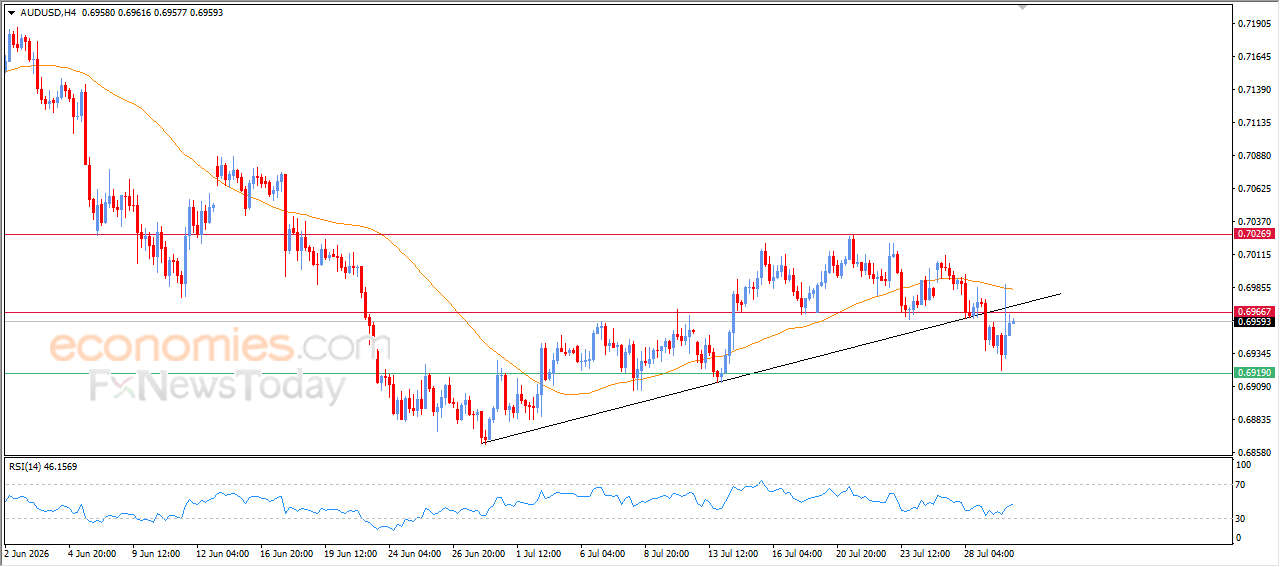
(AUDUSD) rose in its latest intraday trading, attempting to recover some of its previous losses, to retest the previously broken bullish corrective trend line, amid the continuation of the negative pressure that comes from its trading below EMA50, which reduces the chances of full recovery in the near upcoming period, especially with the emergence of negative overlapping signals on the relative strength indicators, after offloading its oversold conditions, which increases the negative pressures.
MoreUSDCAD Declines Affected by Negative Technical Pattern – Analysis –30-07-2026
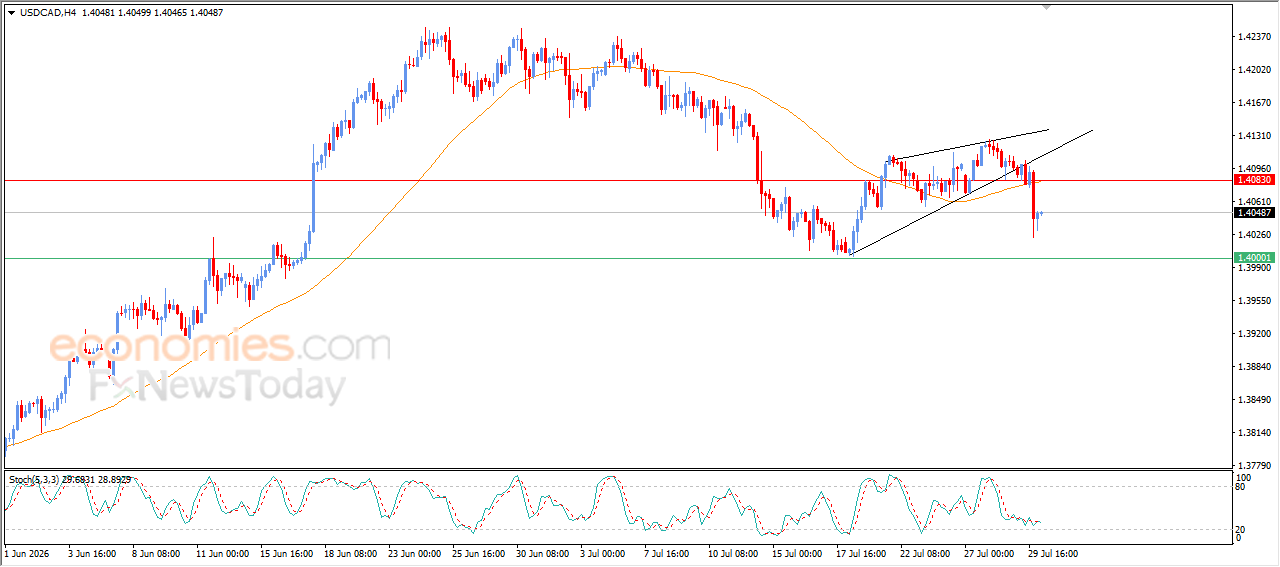
The USDCAD price settles on sharp losses in its last intraday trading, affected by negative technical formation on the short-term basis (the rising wedge pattern), with a negative pressure due to its trading below EMA50, which represents dynamic resistance that intensified with the negative pressure and suggests more declines in the near upcoming period, especially with the emergence of negative signals from the relative strength indicators, despite reaching oversold levels.
More