USDCAD Attacks our Target Resistance – Analysis – 22-05-2026
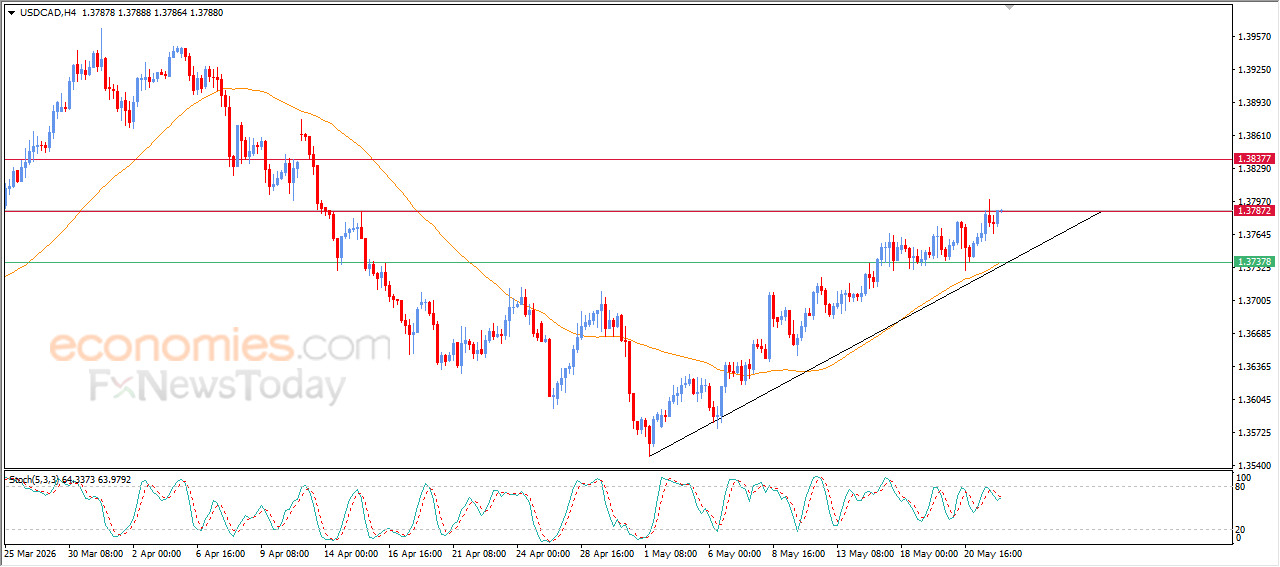
The USDCAD rose during its latest intraday trading, with the pair attacking the resistance level at 1.3785, which was one of our projected price targets in previous analysis. The pair benefited from positive dynamic support generated by trading above EMA50, which reinforces the stability and dominance of the short-term corrective bullish trend, especially as price movements continue alongside a supportive trendline for this upward path.
We notice the beginning of a positive crossover on the relative strength indicators after the pair successfully eased its previous overbought conditions, opening the way to extend its gains in the near term.
USDJPY Circles Around a Pivotal Resistance – Analysis – 22-05-2026
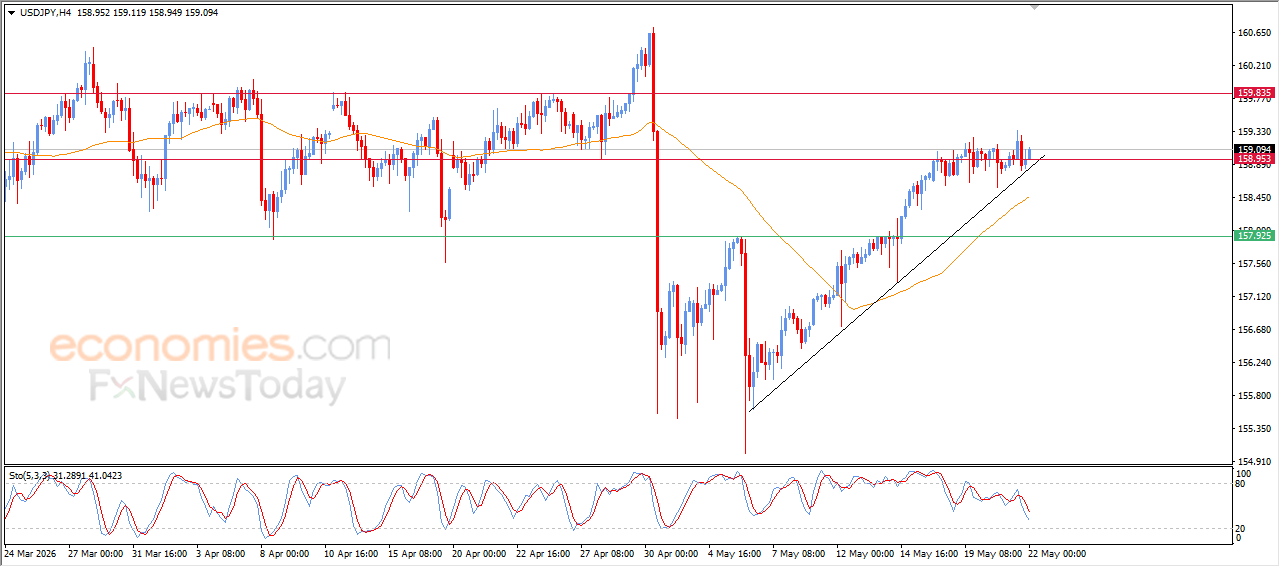
The (USDJPY) rose during its latest intraday trading amid volatile movements, as the pair attempts to gain the positive momentum needed to break above the key and stubborn resistance level at 159.00. This comes amid the dominance of a short-term corrective bullish wave, with price movements aligned alongside a supportive trendline for this path, in addition to dynamic support represented by trading above EMA50.
Meanwhile, the relative strength indicators have reached heavily oversold levels compared to the price movement, suggesting the beginning of a positive divergence formation that could strengthen the chances of further gains for the pair in the near term.
GBPUSD Surrenders to Negative Pressure – Analysis – 22-05-2026
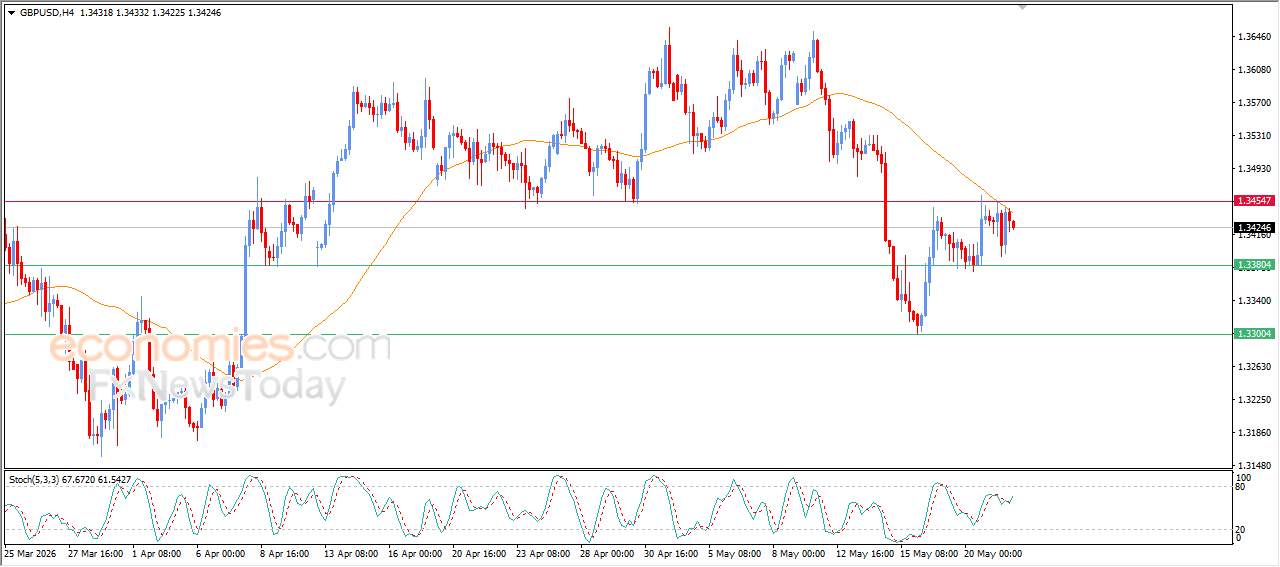
The (GBPUSD) declined during its latest intraday trading after facing resistance at EMA50, forcing the pair to reverse lower following a period of highly volatile movements. This performance comes amid the continued dominance of a short-term corrective bearish trend, which keeps negative pressure controlling the pair’s movement currently.
Despite this, the relative strength indicators have started to show positive signals that may provide temporary support for the pair’s movements and could help slow the current decline, especially if the price succeeds in maintaining nearby support levels and regaining part of its positive momentum in the coming period.
Bitcoin Price Faces Negative Pressure – Analysis – 22-05-2026
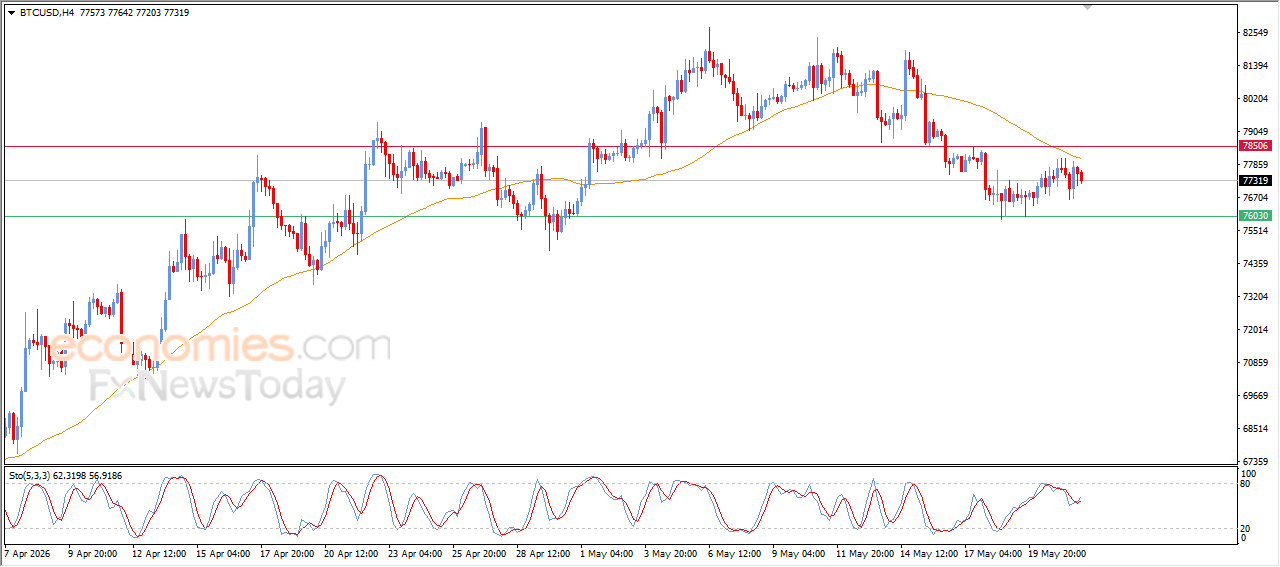
(BTCUSD) declined during its recent intraday trading after encountering resistance at EMA50, which renewed negative pressure on the price movement. This comes amid the continued dominance of a short-term corrective bearish wave, keeping the negative technical outlook for the current period.
The relative strength indicators started to show fresh positive signals after the price eased its previous overbought conditions, providing positive momentum that may help reduce the surrounding selling pressure and potentially allow the price to retest nearby resistance levels if these supportive signals continue.