GBPUSD is Gathering Gains – Analysis – 01-07-2026
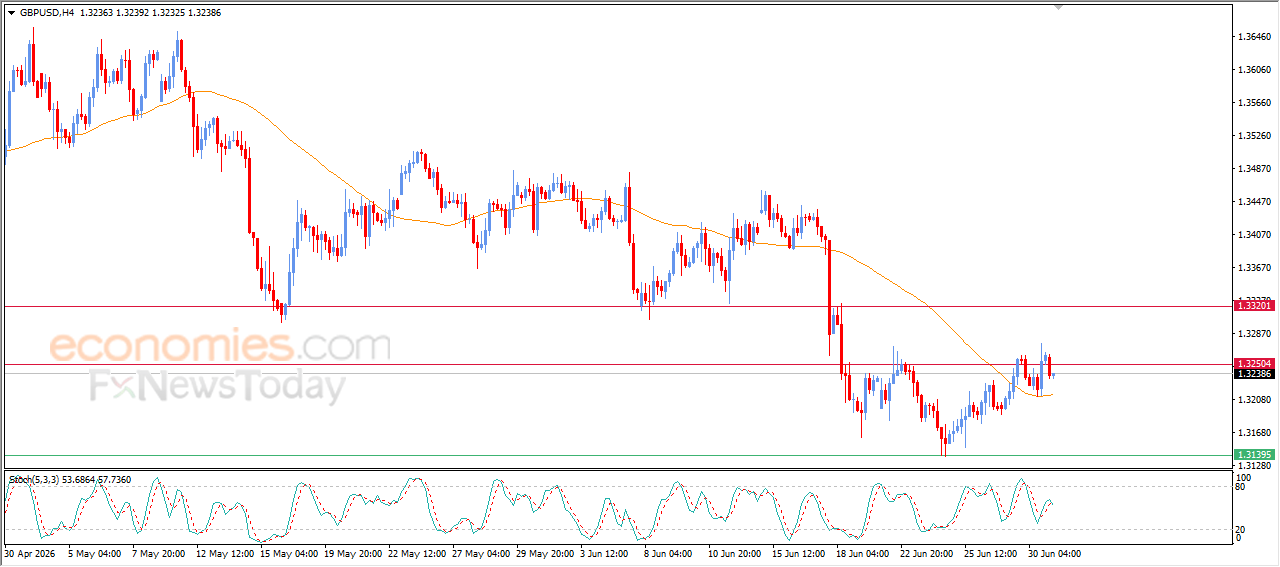
GBPUSD declined in its recent intraday trading, with the stability of the key resistance at 1.3250, to gather the gains of its previous rises, attempting to offload some of its clear overbought conditions on the relative strength indicators, especially with the emergence of the negative signals from them, to gather its positive strength that might help it to breach this resistance, with the dominance of bullish corrective wave on the short-term basis, and the dynamic support that comes from its trading above EMA50, reinforcing the chances of a near-term recovery.
Bitcoin (BTCUSD) Prepares to Break Below Our Target Support – Analysis – 01-07-2026
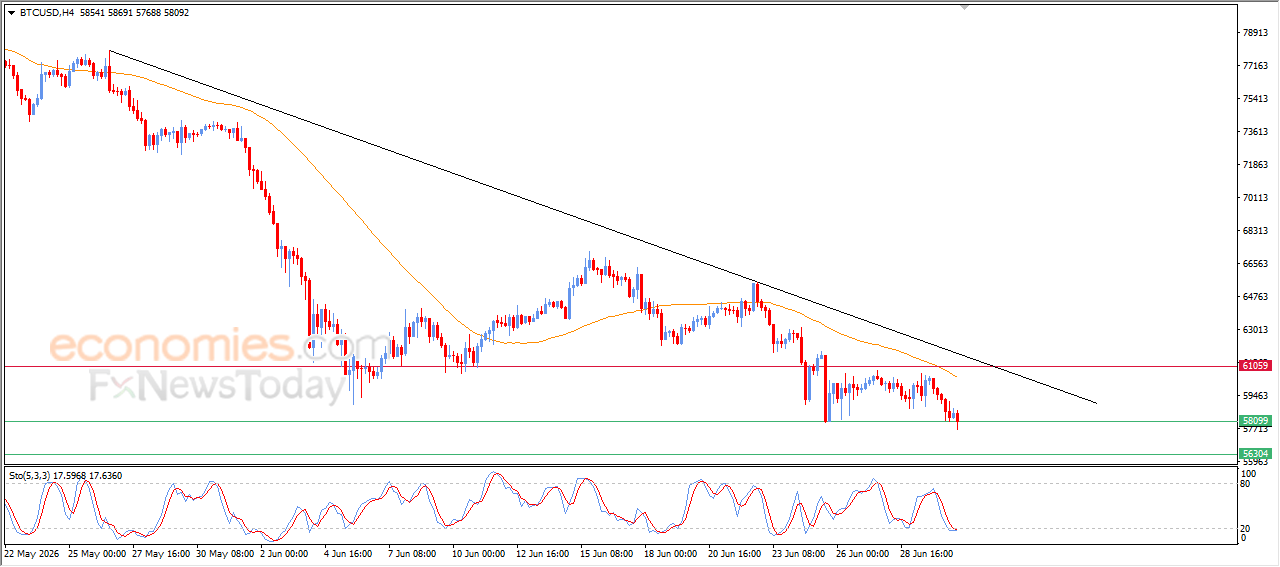
Bitcoin (BTCUSD) declined during recent intraday trading, approaching a break below the key support level at $58,000, which was our previous expected target, as selling pressure continues to dominate price action.
The technical outlook remains bearish, with the dominance of the short-term bearish trend still. Bitcoin continues to trade below the EMA50, which acts as dynamic resistance and limits recovery attempts. Meanwhile, relative strength indicators remain negative despite reaching oversold levels, reflecting the strength of the bearish trend and continued seller dominance.
Crude Oil Trades Within a tight Range – Analysis – 01-07-2026
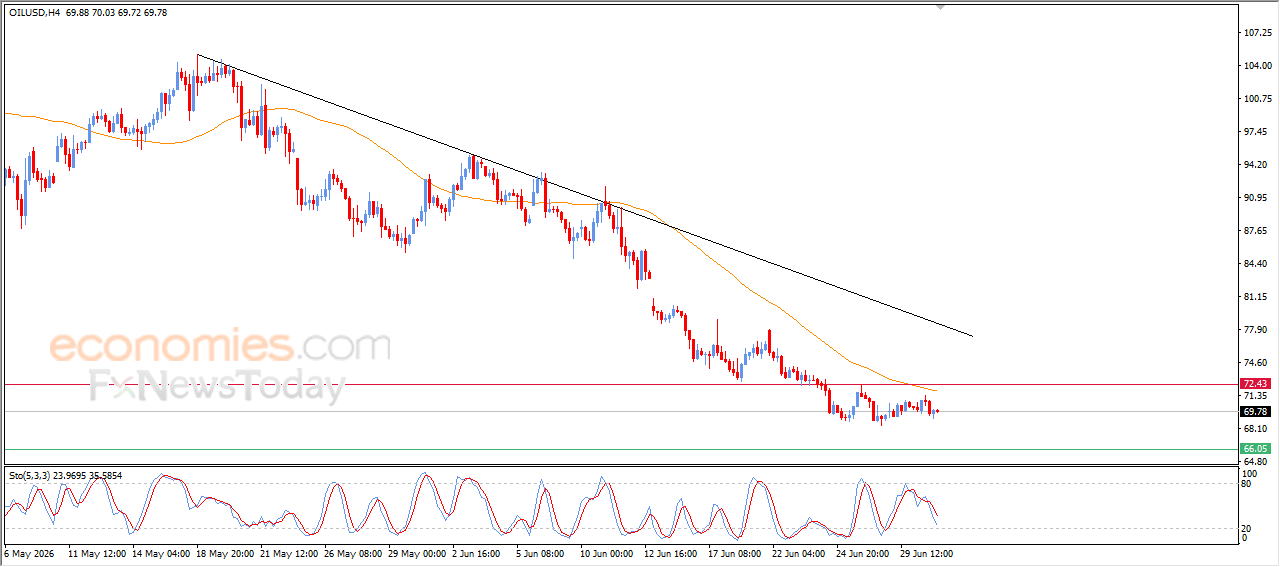
Crude Oil continued its sideways trading during recent intraday sessions, moving within a tight range that reflects cautious market sentiment, with prices still lacking the required momentum to exit this range.
The technical outlook remains bearish, due to the negative signals that come from relative strength indicators after reaching overbought levels, signaling fading bullish momentum and increasing the risk of renewed selling pressure. Meanwhile, prices remain below EMA50, which continues to act as dynamic resistance and reinforces the prevailing short-term downtrend.
Silver Prices Remains Under Negative Pressure –Analysis – 01-07-2026
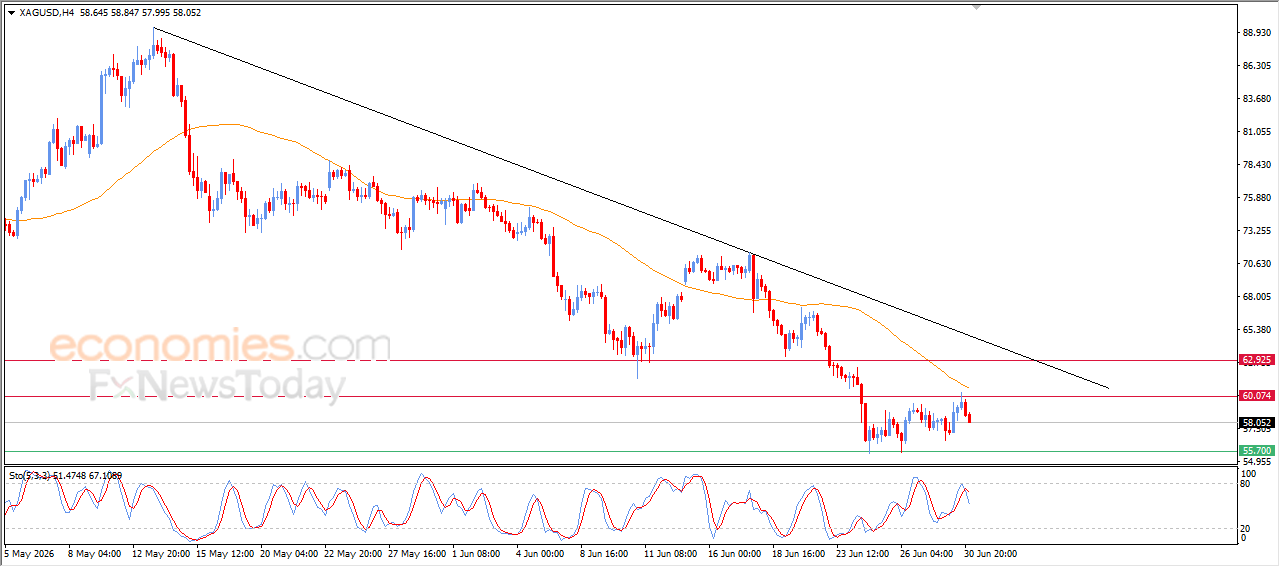
Silver declined during recent intraday trading after the $60.00 resistance level halted its latest recovery attempt, bouncing lower as selling pressure continued to dominate.
Silver remains below the EMA50, which continues to act as dynamic resistance and reinforces the dominance and stability of the short-term bearish trend. Meanwhile, relative strength indicators began to send negative signals following the formation of a bearish divergence, signaling weakening buying momentum and increasing the likelihood of further losses in the near term.