The CHFJPY faces strong barrier– Forecast today – 15-5-2026
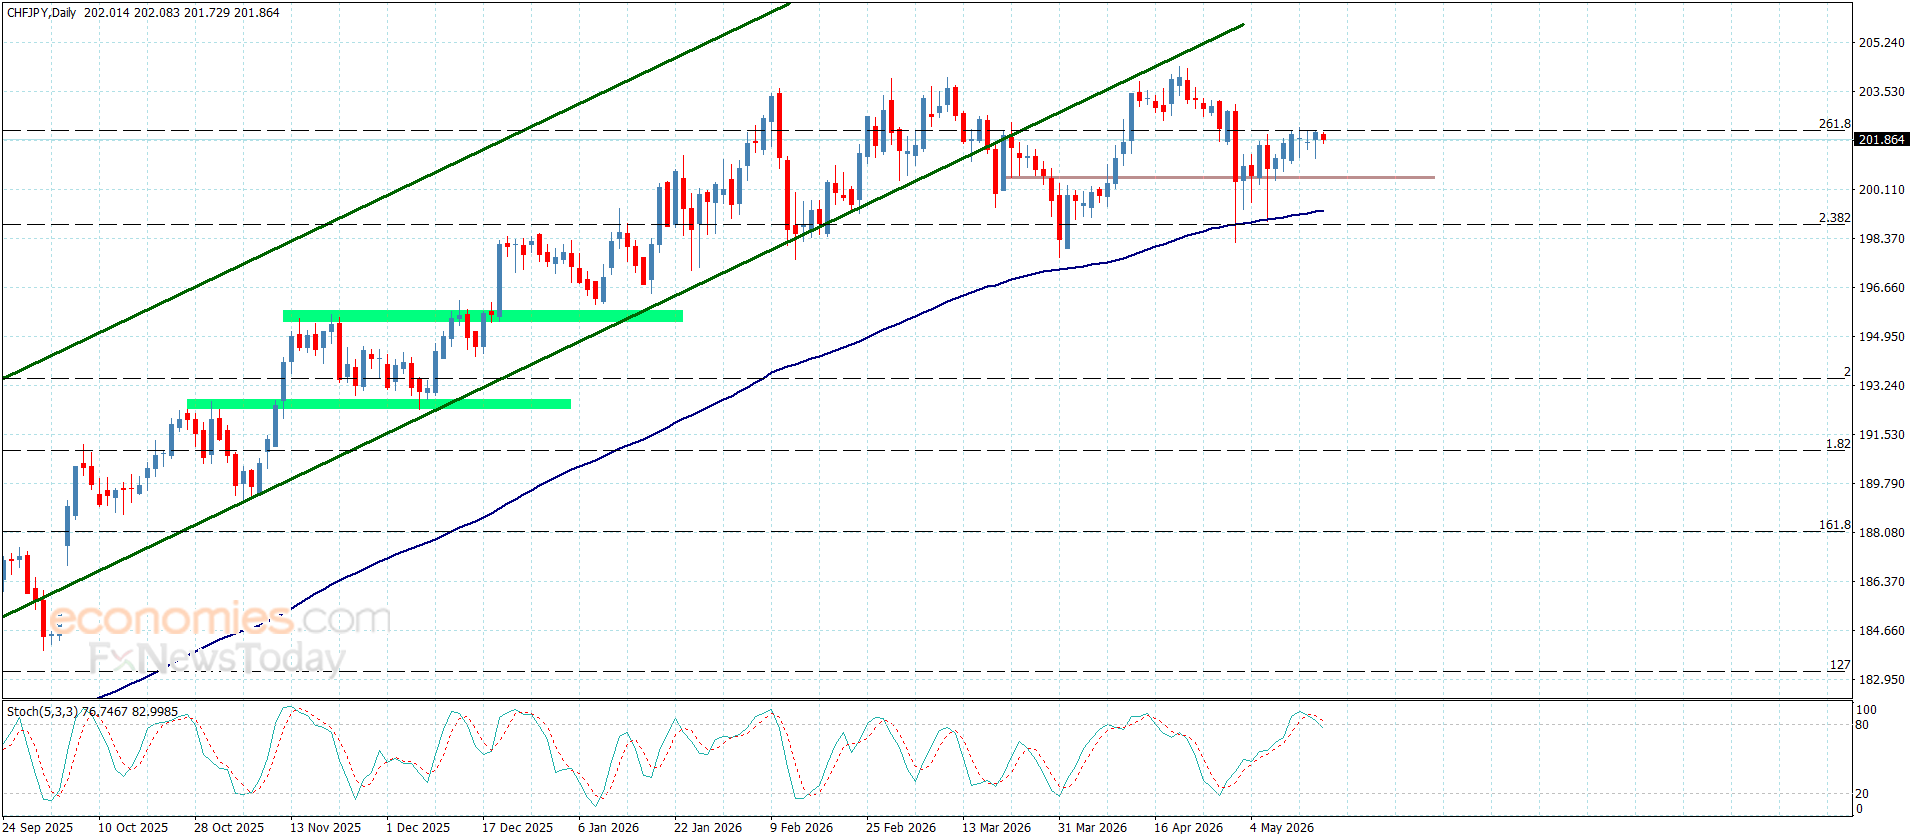
The pair has formed several bullish waves in recent trading, testing the 261.8% Fibonacci extension level, which acts as an important resistance at 202.20. This has forced the price into a negative pullback, stabilizing around 201.75.
If the price remains below this current resistance, and with the stochastic indicator showing negative momentum, stronger bearish waves may begin to form, targeting 201.10 initially, followed by renewed pressure on the support at 200.50.
However, a breakout above the resistance and sustained trading above it would give the price an opportunity to record additional gains, first toward 202.60 and then extending to 203.20.
The expected trading range for today is between 201.10 and 212.20
Trend forecast: Bearish
The EURJPY reaches the initial target– Forecast today – 15-5-2026
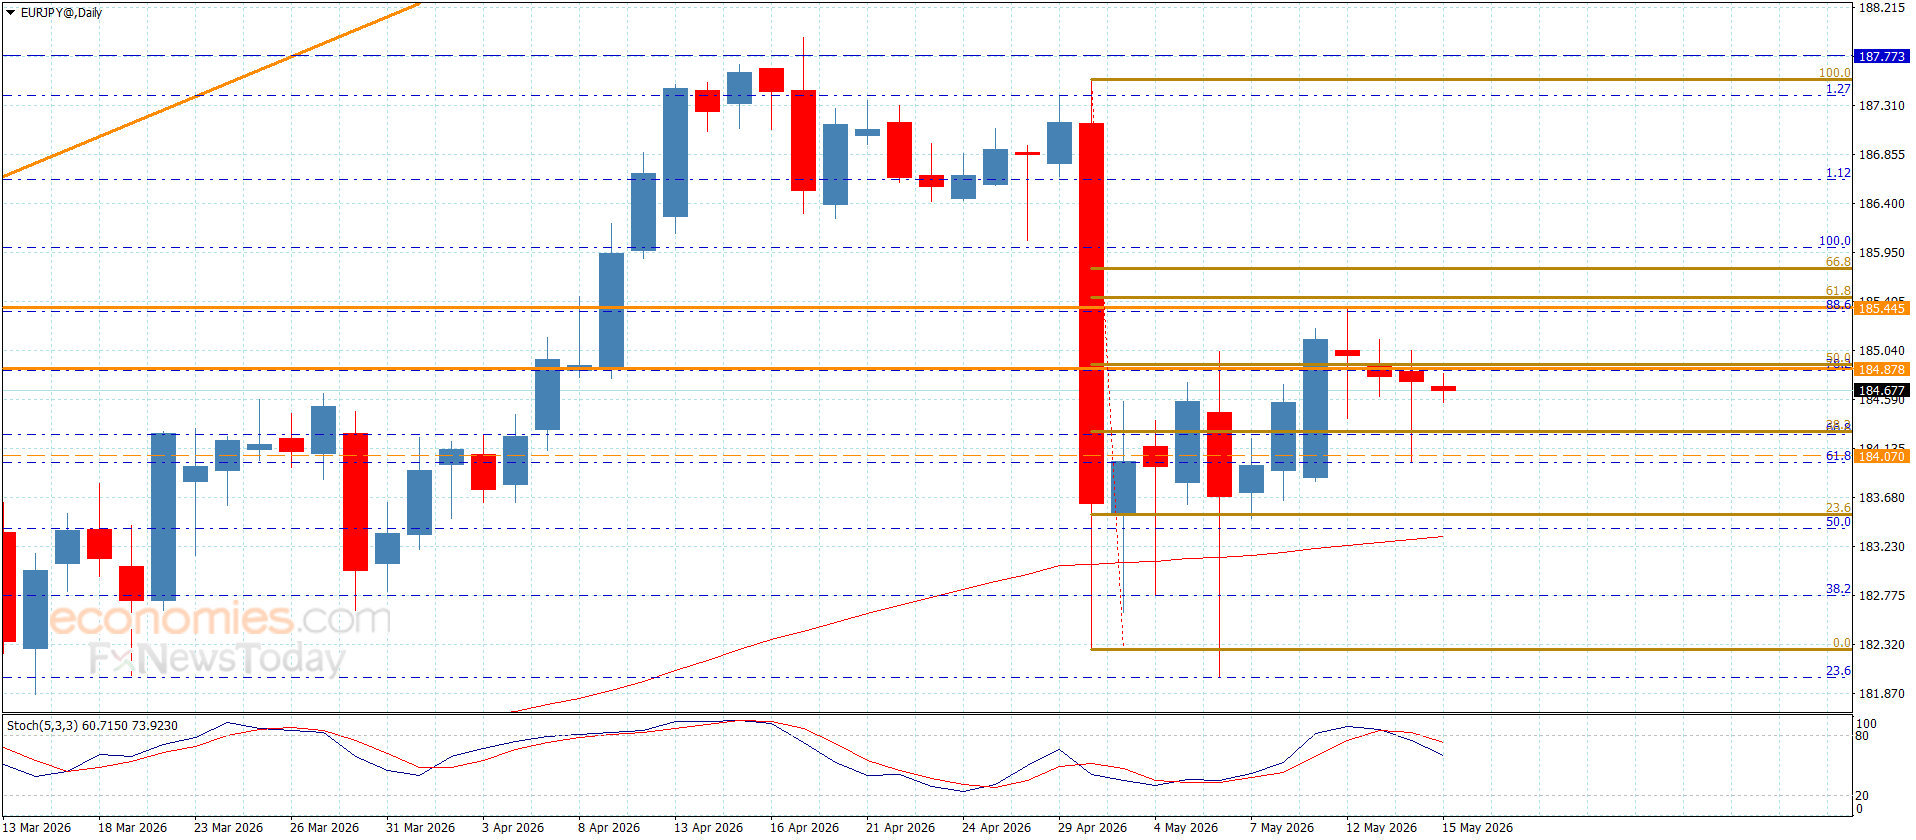
The EURJPY pair formed a new bearish wave during yesterday’s trading, reaching the first target at 184.10, where it encountered the 61.8% Fibonacci retracement level before quickly rebounding toward 184.80, as shown on the attached chart.
We reiterate that the bearish scenario remains valid as long as the main resistance at 185.50 holds. Therefore, we continue to wait for additional negative momentum accumulation, which could enable a break below 184.10 and open the way toward new downside targets at 183.50 and 182.75.
The expected trading range for today is between 183.50 and 185.00
Trend forecast: Bearish
The GBPJPY reaches the initial target– Forecast today – 15-5-2026
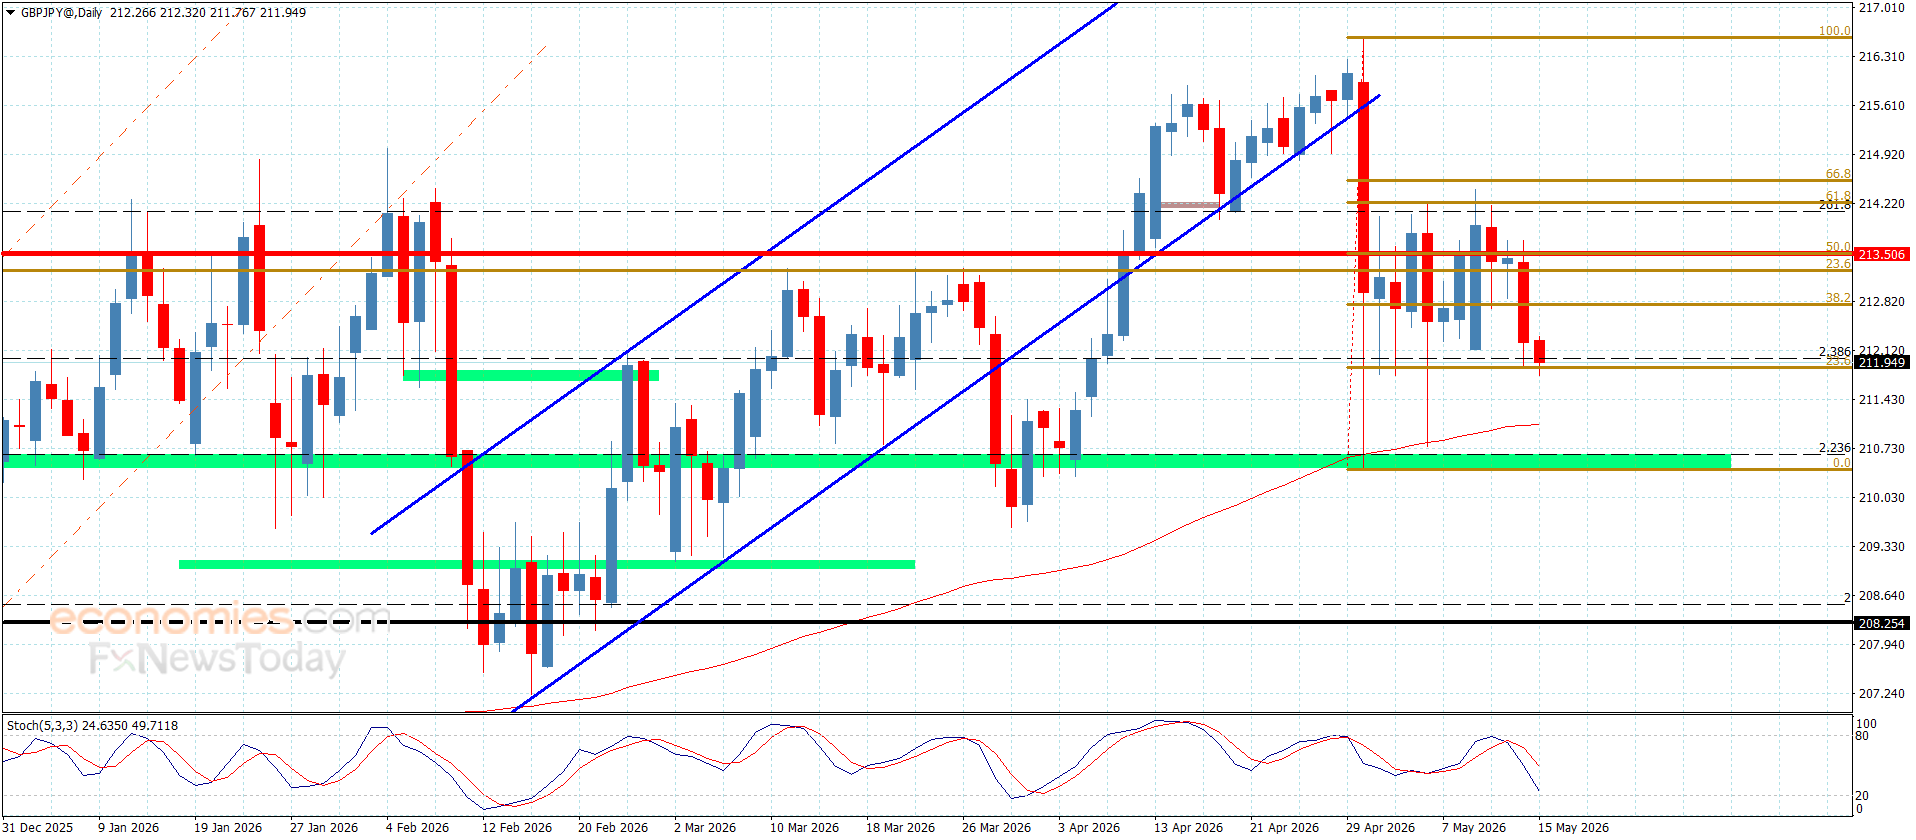
The GBPJPY pair confirmed the bearish corrective scenario, taking advantage of the stochastic indicator’s negative momentum. It is currently moving toward the first corrective target at 211.80.
Continued trading below the 50% Fibonacci retracement level at 213.50, along with the presence of negative momentum, may push the price to extend its corrective movement, with a potential near-term target at 211.30, before attempting to pressure the key support at 210.45.
The expected trading range for today is between 210.45 and 212.90
Trend forecast: Bearish
Platinum price delays the rise– Forecast today – 15-5-2026
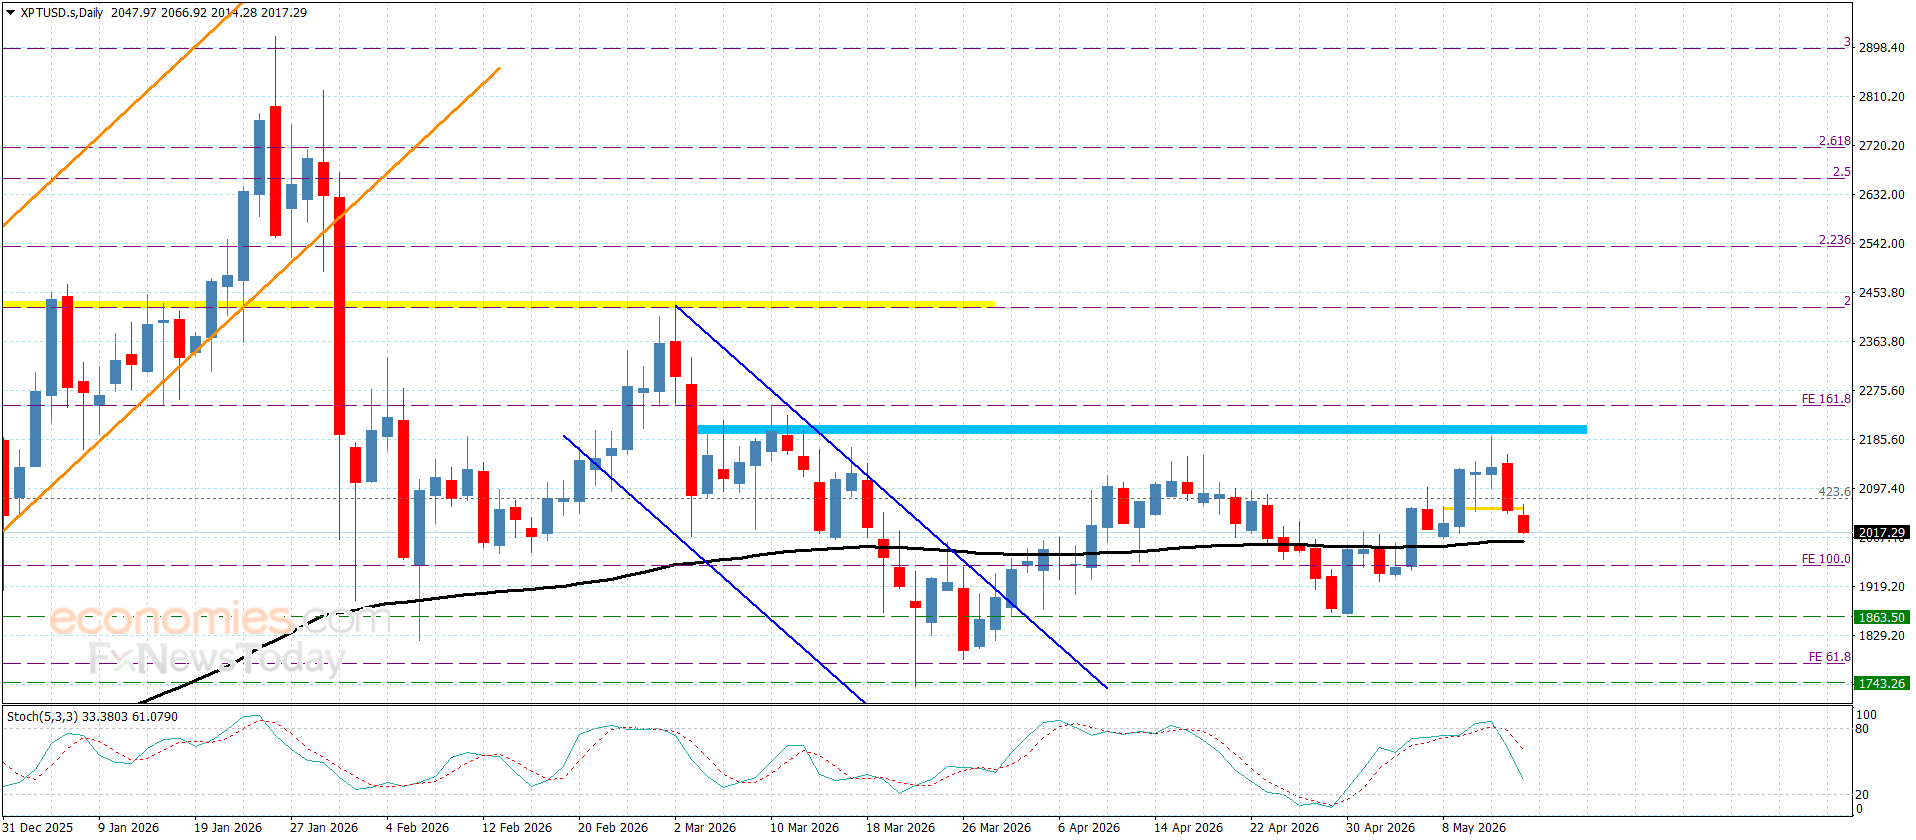
Platinum announced the end of its upward momentum, as the formation of strong resistance at $2,190.00 has halted the bullish move. Since yesterday, it has been forming negative corrective waves and is now trading below the initial support level at $2,060.00, confirming its shift into a downward corrective scenario.
Additionally, the stochastic indicator is showing negative momentum, which may push the price to pressure the 55-day moving average located at $2,000.00. A break below this level could extend losses toward the next support at $1,950.00.
The expected trading range for today is between $1950.00 and $2080.00
Trend forecast: Bearish