Bitcoin Shows Fresh Bearish Signals – Analysis – 11-06-2026
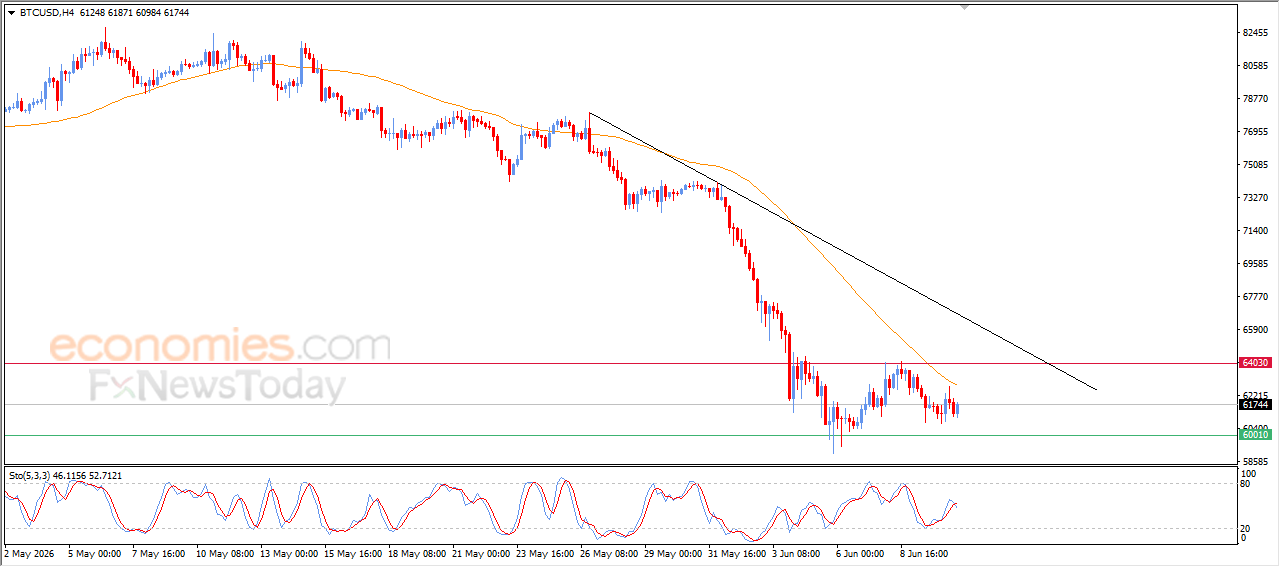
Bitcoin (BTCUSD) fluctuated in recent intraday sessions, while the primary short-term downtrend remains in control, limiting the ability to establish a sustainable recovery. The price continues to trade below EMA50, which acts as a dynamic resistance level and reinforces bearish pressure.
Meanwhile, relative strength indicators started to generate a new bearish crossover after offloading oversold conditions, to indicate renewing downside momentum and a return of selling pressure, supporting the likelihood of further declines in the near term unless stronger technical signals emerge to shift the current trend.
Crude Oil Shows Mixed Signals – Analysis – 11-06-2026
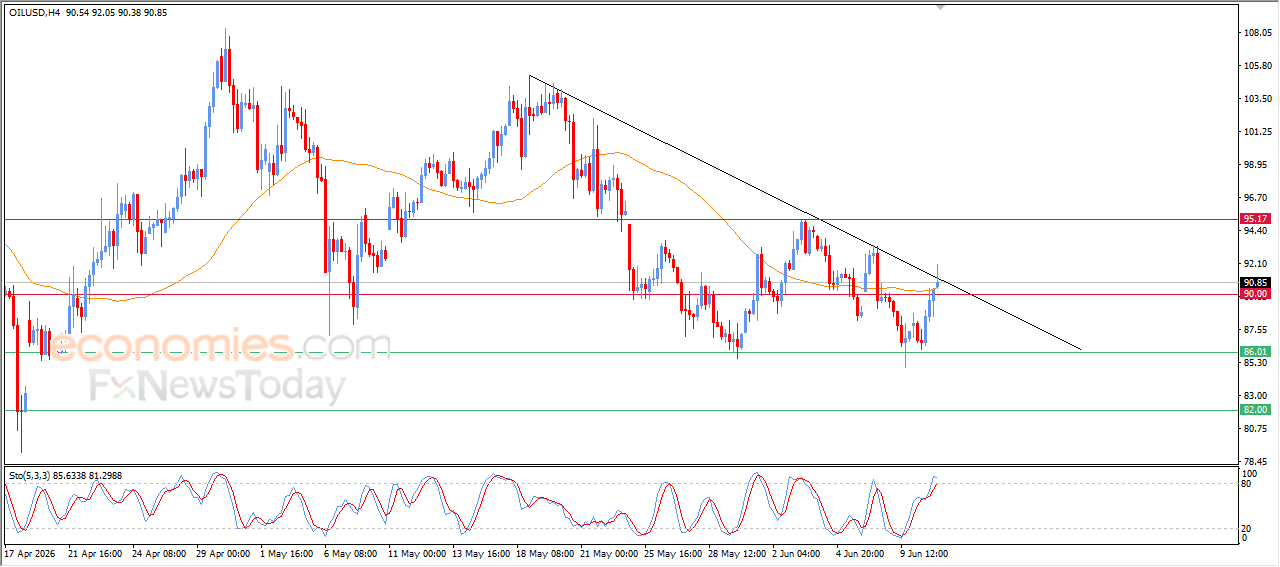
Crude Oil extended its gains during recent intraday trading and moved above the EMA50, a positive technical signal that reflects improving buying momentum and increases the chances of further recovery in the near term.
MoreSilver Continues to Slide –Analysis – 11-06-2026
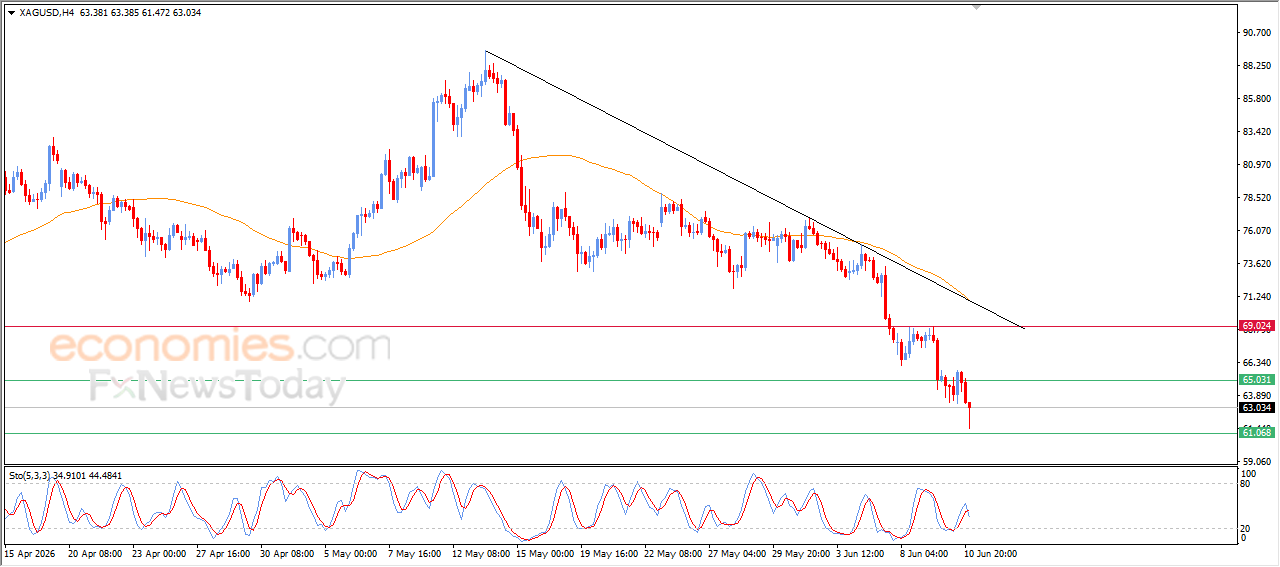
Silver extended its losses in recent intraday trading, confirming a break below the $65.00 support level. This move reinforces the bearish outlook, with the metal continuing to follow a short-term downtrend supported by a descending trend line.
MoreGold Breaks Our Final Target – Analysis – 11-06-2026
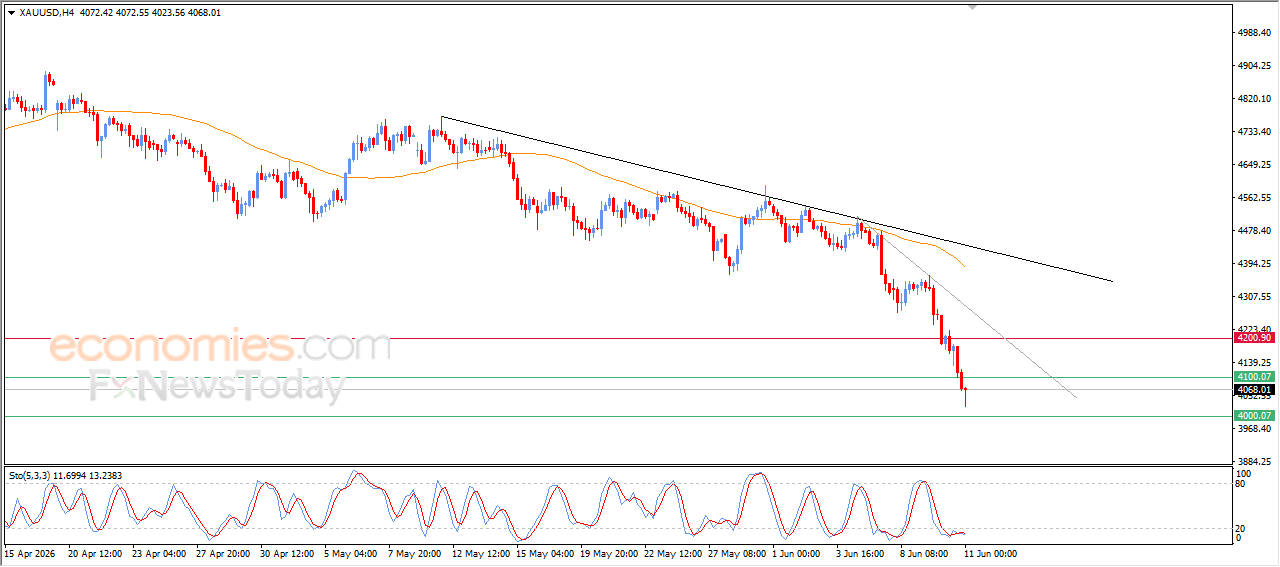
Gold continued its intraday decline, breaking below the $4,100 support level, our final target in prior analysis. This move comes despite relative strength indicators remaining deeply oversold, reflecting weak response to rebound attempts and confirming the strength of the downtrend.
More