Bitcoin Price Prepares to Challenge Key Resistance – Analysis – 15-05-2026
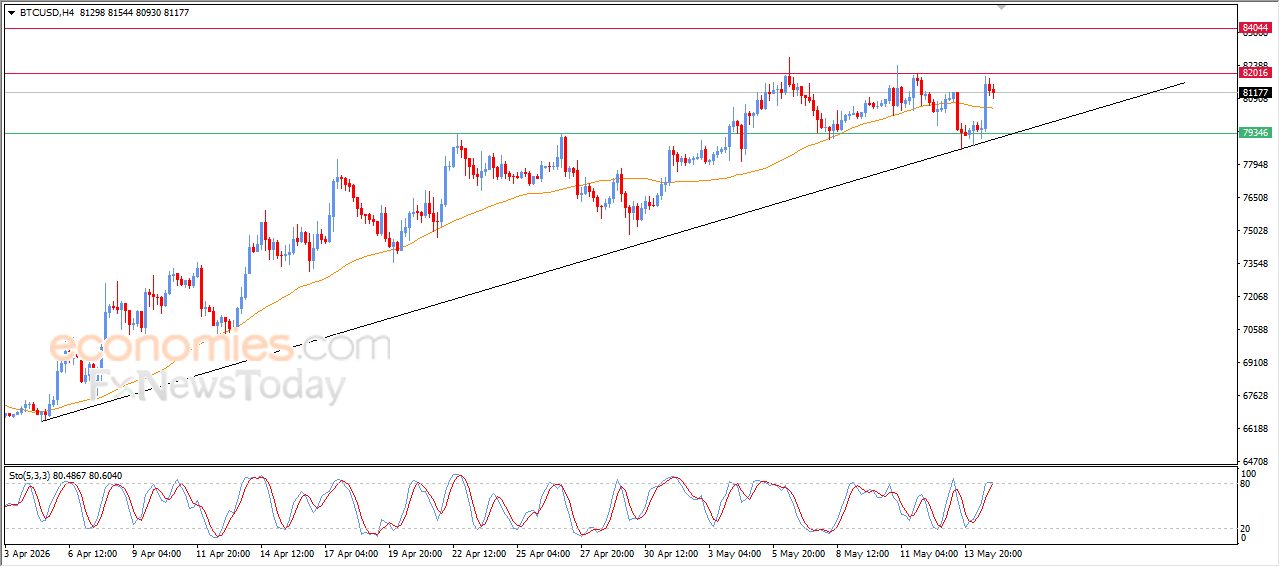
Bitcoin price (BTCUSD) edged slightly lower during recent intraday trading in what appears to be a limited correction aimed at gaining fresh positive momentum that could help the cryptocurrency break above the key and stubborn resistance level at $82,000. The price continues to receive solid support from trading above its EMA50, reinforcing the stability of the main short-term bullish trend.
These movements also coincide with continued positive signals from relative strength indicators, despite reaching heavily overbought levels, which may lead to temporary fluctuations without cancelling the positive outlook as long as current support levels remain intact.
Crude Oil Price Benefits from Technical Momentum and Extends Gains – Analysis – 15-05-2026
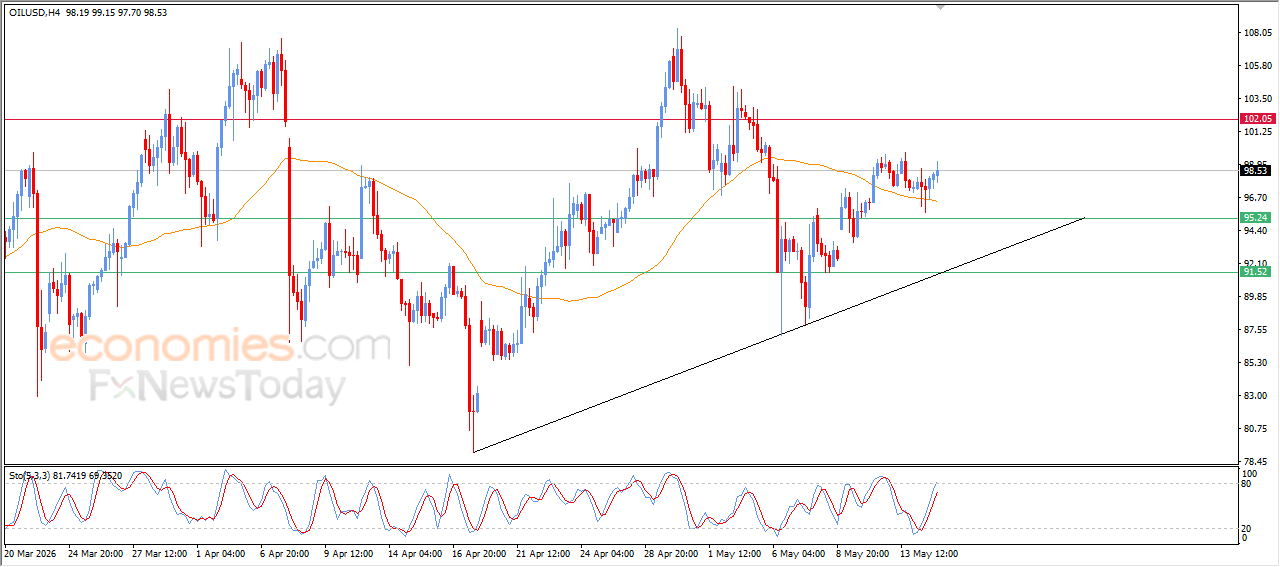
Crude Oil price climbed during recent intraday trading after finding support at EMA50, which provided positive momentum and helped the commodity regain some buying strength. This performance comes amid the dominance of the main short-term bullish trend, with prices moving along a supportive trend line that reflects the continued strength of the current upward path.
The price is also receiving additional support from positive signals appearing on relative strength indicators, reinforcing the chances of continued bullish momentum in the near term as long as prices remain above key support levels.
Silver Price Finds Support at Its Simple Moving Average – Analysis – 15-05-2026
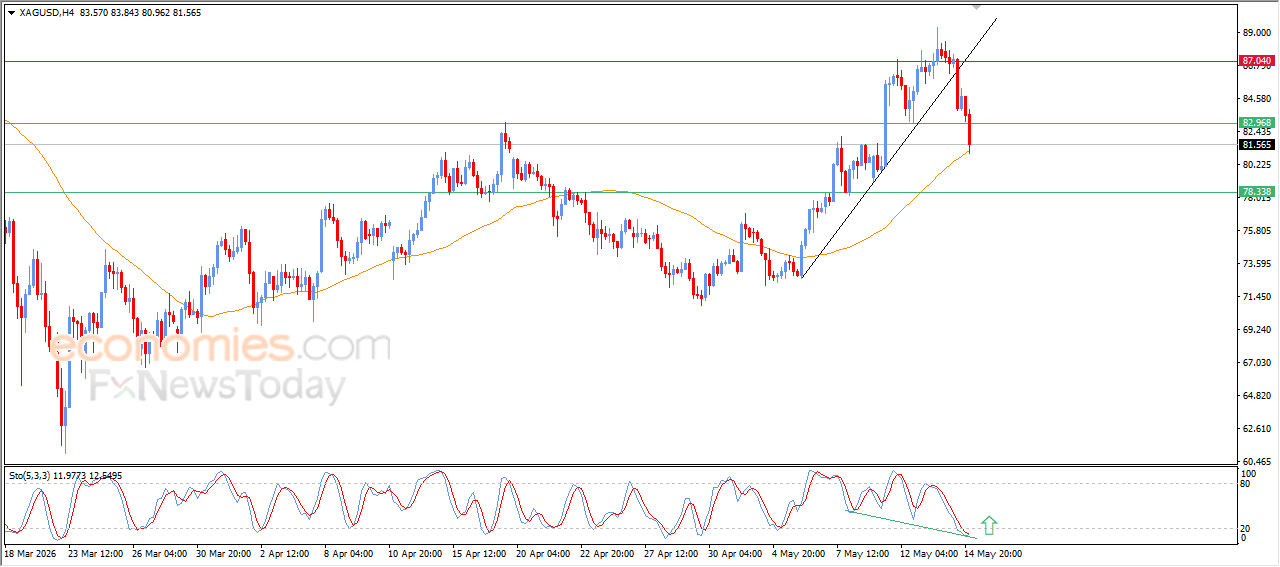
Silver price slipped lower during recent intraday trading as the market searched for a new higher low that could serve as a base for regaining positive momentum and resuming recovery. The price has now reached support at EMA50, which represents a key technical support level that may help the metal stabilize and rebound, especially as the main short-term bullish trend remains intact.
Meanwhile, relative strength indicators have reached heavily oversold levels compared to price movement, suggesting the formation of a positive divergence that could support recovery prospects in the coming period, particularly if buying momentum gradually returns and current support levels hold firm.
Gold Price Faces Increasing Selling Pressure – Analysis – 15-05-2026
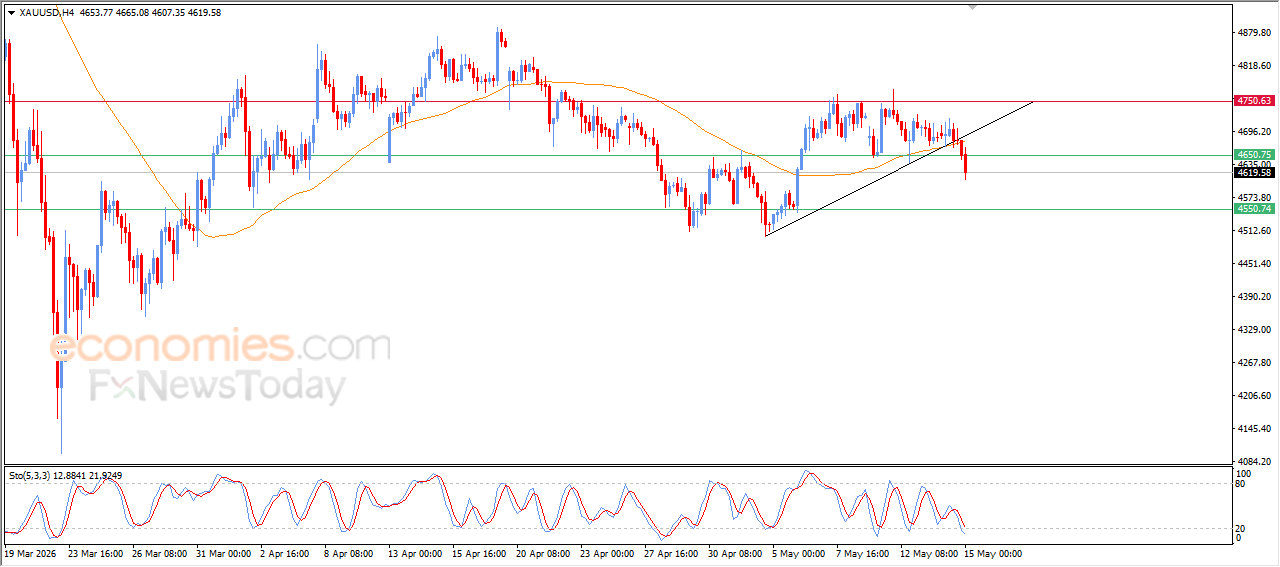
Gold price declined during recent intraday trading, confirming a break below a minor upward trend line in the short term. This technical signal reflects rising selling pressure and weakening positive momentum that had previously supported price movements. The decline also came alongside a break below the 50-period simple moving average, increasing negative pressure on gold and strengthening the chances of further losses in the near term.
Meanwhile, relative strength indicators continue to send negative signals despite reaching heavily oversold levels, reflecting continued seller dominance over price action.