Platinum price achieves the target– Forecast today – 14-5-2026
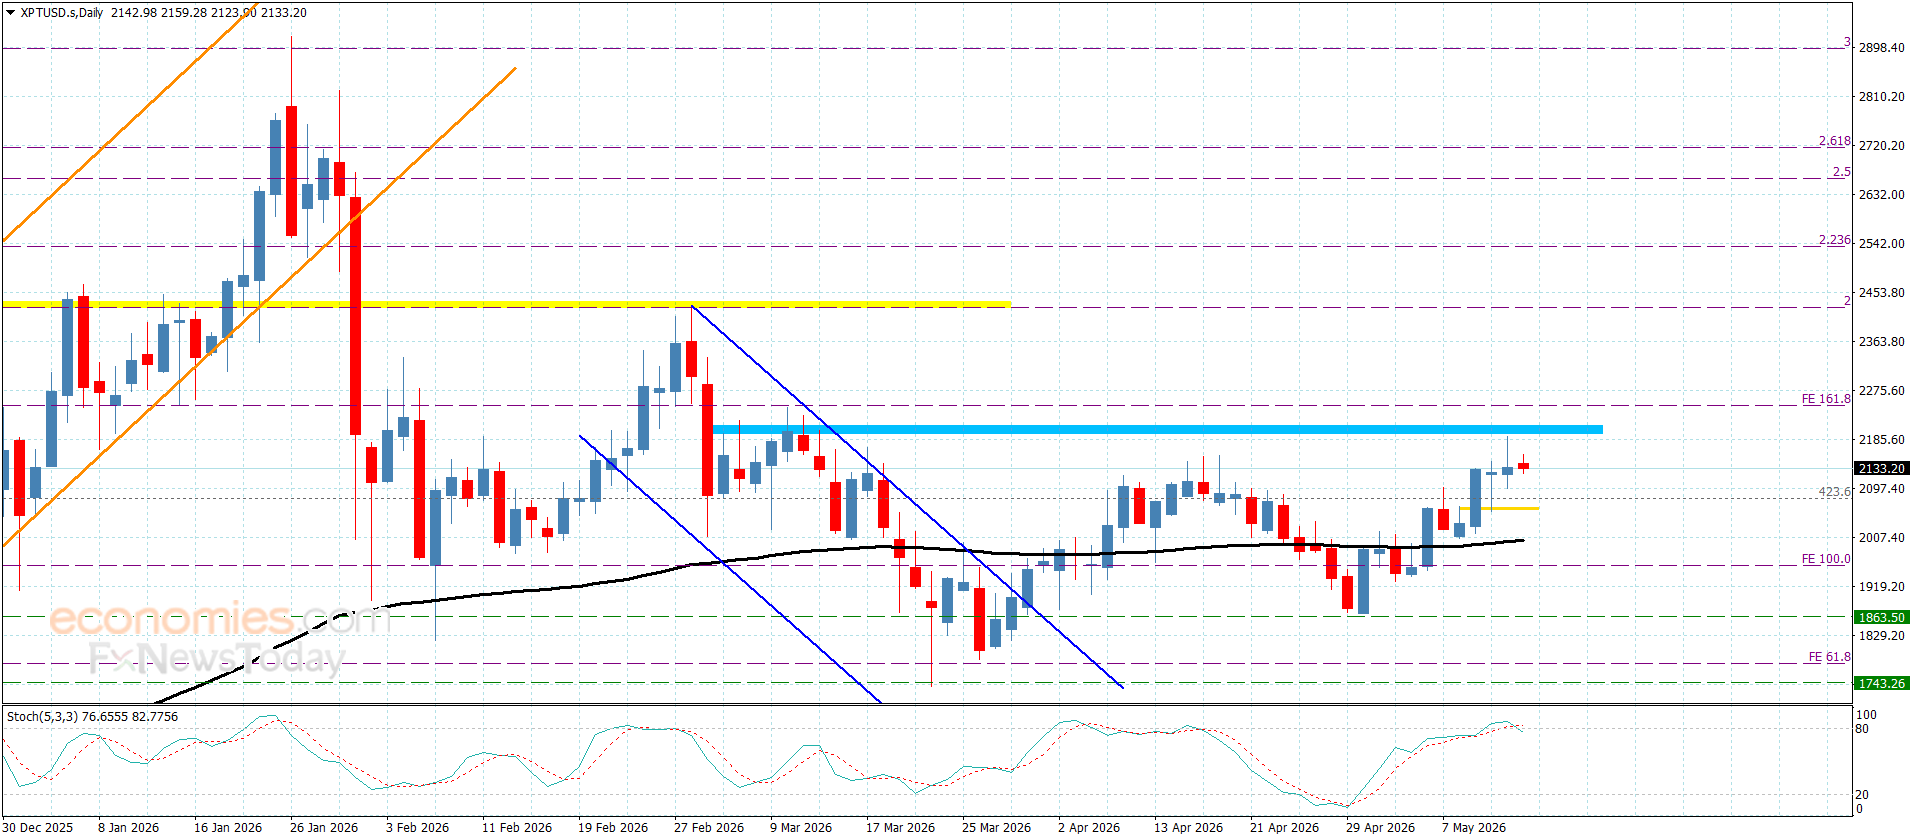
Platinum price reached $2191.00 level by its last bullish rally, approaching the previously waited main target, to form temporary corrective rebound towards $2135.00, affected by stochastic attempt to exit the overbought level as appears in the above image.
The price might be forced to provide some mixed trading, however it settles above $2060.00 makes us keep the bullish scenario, to keep waiting for surpassing $2195.00 level, extending the trading towards %161.8 Fibonacci extension level at $2245.00.
The expected trading range for today is between $2110.00 and $2215.00
Trend forecast: Bullish
Copper price catches its breath– Forecast today – 14-5-2026
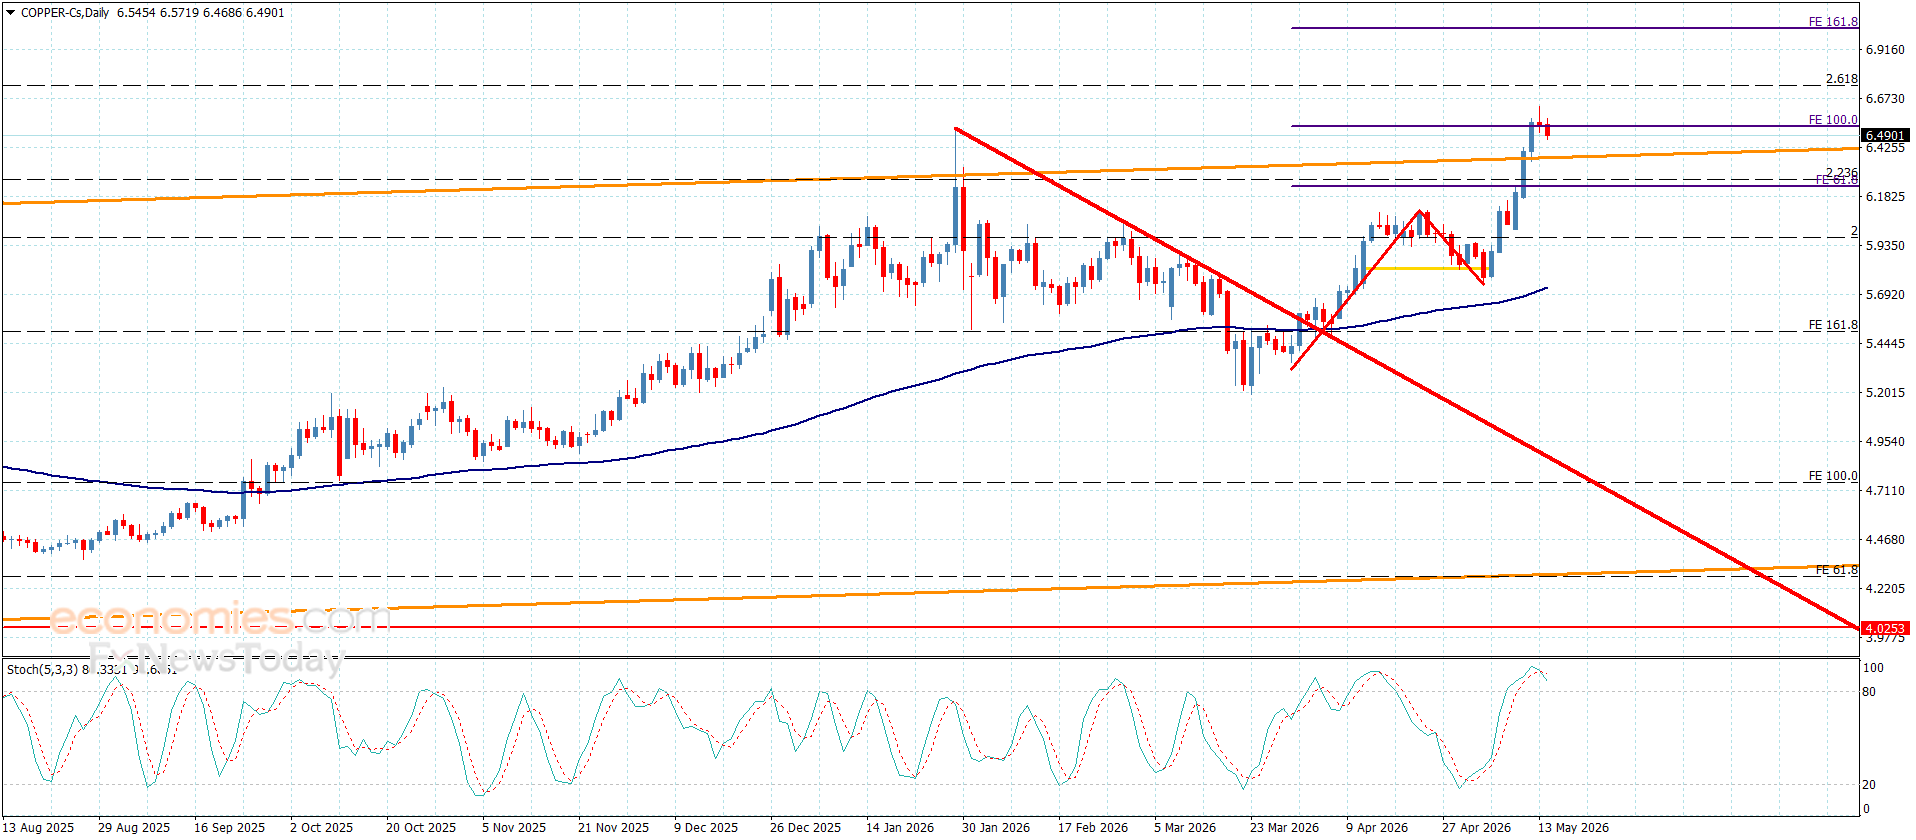
Copper price reached $6.6300 level by its bullish rally, forcing it to form temporary corrective rebound towards $6.4800, attempting to catch its breath and gather some gains.
The stability above the extra support at $6.1000 makes us keeps the bullish scenario, to expect forming new bullish waves by gathering the positive momentum, attempting to reach the next target near $6.7300.
The expected trading range for today is between $6.2000 and $6.6000
Trend forecast: Fluctuated
Ethereum (ETHUSD) Faces Negative Pressure – Analysis – 14-05-2026
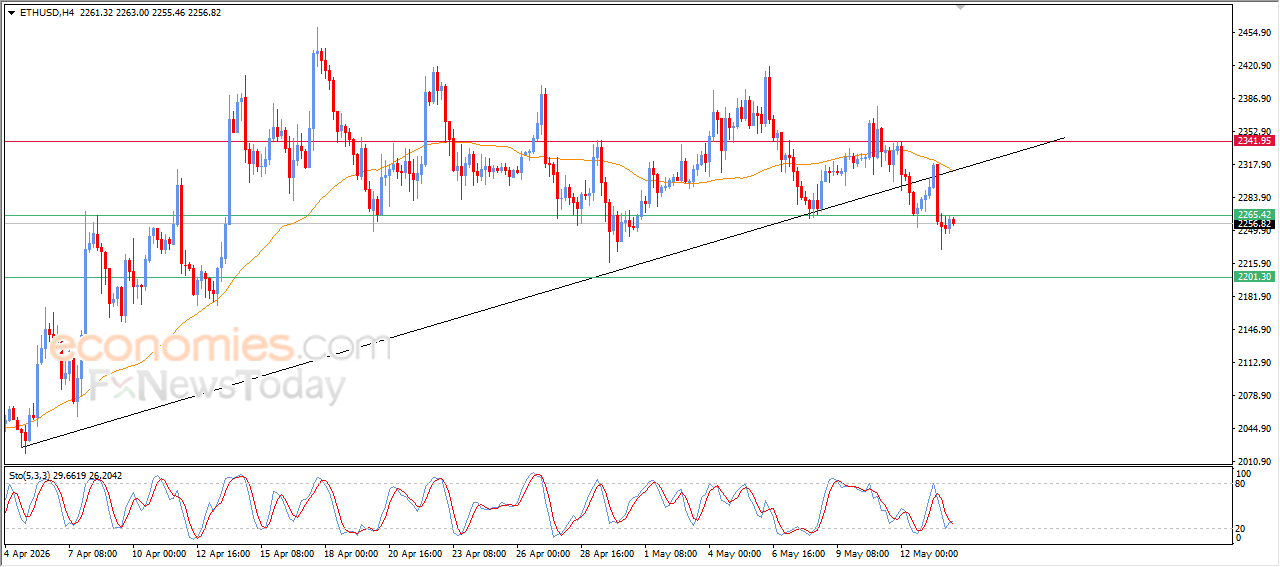
Ethereum price (ETHUSD) is holding sharp losses during recent intraday trading, affected by a previous break below a major short-term upward trendline. The price is also under negative dynamic pressure as it continues trading below its EMA50, which reduces the chances of a full recovery in the near term.
On the other hand, positive crossover signals appear on the relative strength indicators after reaching deeply oversold conditions, which helped the price stabilize temporarily as it attempts to relieve some of this oversold pressure.
Brent Crude Oil Shows New Positive Signals – Analysis – 14-05-2026
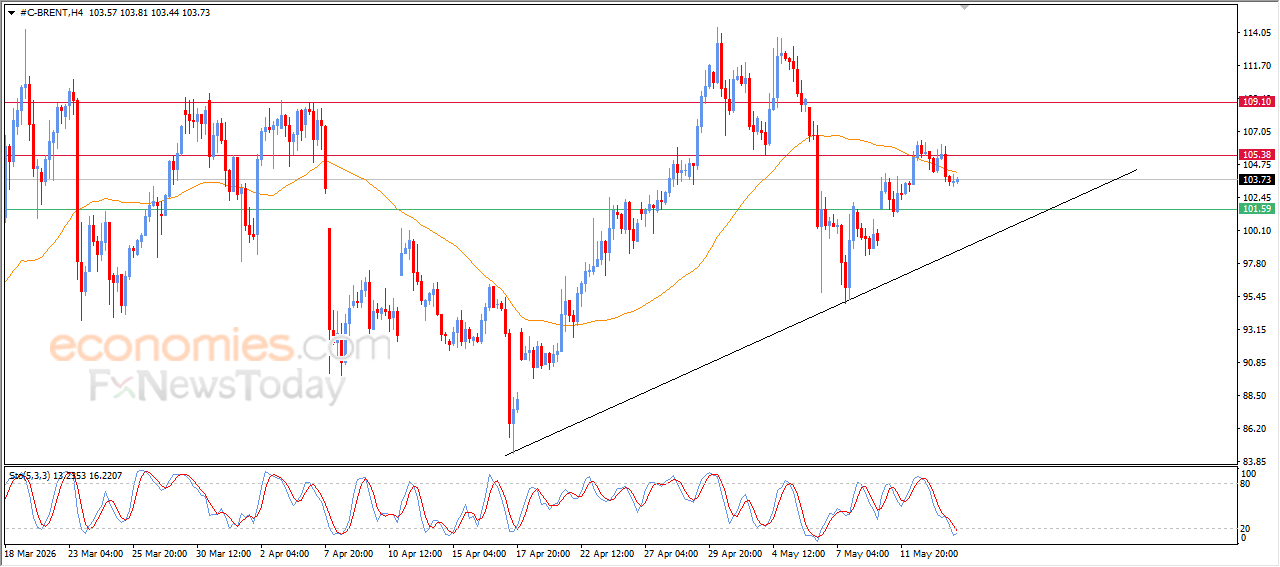
Brent crude oil is trading lower in recent intraday sessions, under continued negative pressure caused by its trading below the EMA50. The price is attempting to gain positive momentum that could help it overcome this bearish pressure, especially as the main short-term bullish trend remains in place, with price movements continuing along a supportive trendline for this upward path.
In the background, positive crossover signals are starting to appear on the relative strength indicators after reaching deeply oversold levels in a way that is exaggerated compared to price movement. This suggests the early formation of a positive divergence, which supports the chances of a near-term recovery.