Crude oil price within sideways track – Analysis - 30-05-2023

Crude oil price fluctuates within sideways range between 71.55 support and 73.80 resistance, finding difficulty to exit this range, to suggest the continuation of the sideways move until the price manages to surpass one of these levels to detect its next destination clearly.
Note that breaching the mentioned resistance will push the price to build bullish wave on the intraday and short term basis, to head towards achieving gains that start at 76.10 and extend to 78.90, while breaking the support represents negative factor that will push the price to resume the main bearish trend and head towards 68.75 as a next main target.
The expected trading range for today is between 71.00 support and 74.70 resistance.
The expected trend for today: Sideways
Silver price attempts to recover - Analysis - 30-05-2023
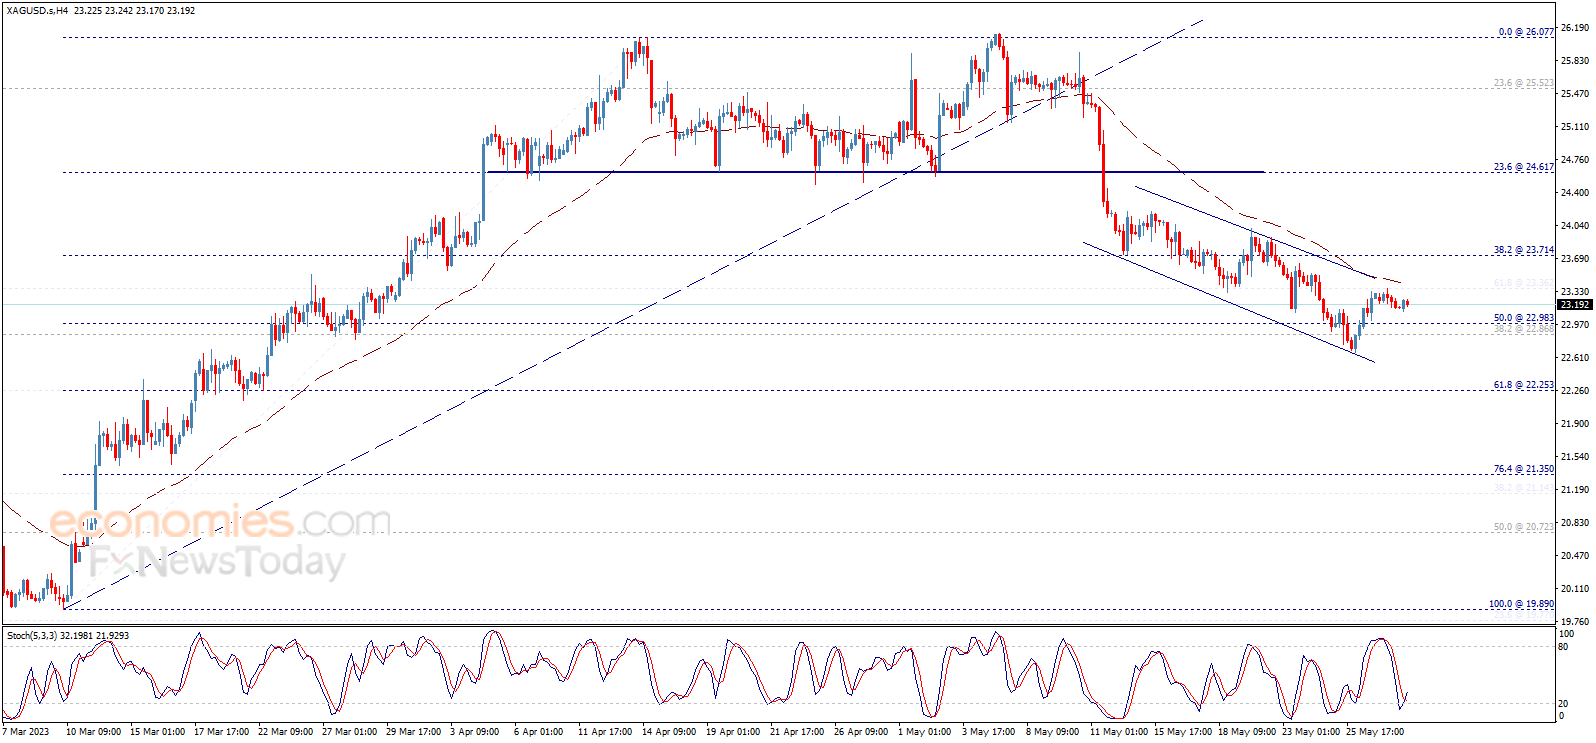
Silver price traded with clear positivity in the previous sessions to settle above 23.00 level, noticing that the price moves within bearish channel that appears on the chart, falling under negative pressure formed by the EMA50, which meets the bearish channel’s resistance to add more strength to it.
Therefore, we believe that the chances valid to resume the correctional bearish trend, which its targets begin by breaking 23.00 to open the wat to rally towards 22.25, taking into consideration that breaching 23.30 will push the price to achieve additional gains and test 23.70 before any new attempt to decline.
The expected trading range for today is between 22.50 support and 23.50 resistance.
The expected trend for today: Bearish
Gold price gets a negative close – Analysis - 30-05-2023

Gold prices closed the last daily candlestick below 1945.20 level, to support the continuation of the expected bearish trend for the upcoming period, reminding you that our next target is located at 1913.15.
The price needs to break the bullish channel’s support line at 1939.90 to confirm the continuation of the decline, as consolidating above it might push the price to build new bullish wave and attempt to regain the main bullish trend again.
In general, the negative scenario will remain suggested conditioned by the price stability below 1961.30 and 1977.25 levels, as breaching them will stop the bearish correction and lead the price to return to the main bullish track.
The expected trading range for today is between 1925.00 support and 1960.00 resistance.
The expected trend for today: Bearish
The USDCAD gains the positive momentum – Analysis - 30-05-2023

The USDCAD pair is facing negative pressure to test the intraday bullish channel’s support line that appears on the chart, and the EMA50 meets this support to add more strength to it, accompanied by witnessing clear positive signals through stochastic.
Therefore, these factors encourage us to continue suggesting the bullish trend for the upcoming period, which targets 1.3680 as a next main station, noting that breaking 1.3560 will put the price under additional negative pressure to test 1.3500 before any new positive attempt.
The expected trading range for today is between 1.3520 support and 1.3660 resistance.
The expected trend for today: Bullish