Gold Technical Analysis
Stay up to date with our exclusive technical analysis about Gold written by our top analysts. The analysis is updated around the clock and covers any price change in the 3 major sessions: American, Asian and European. The technical indicators applied on the charts will help you predict the trend of the Gold rate
Gold price - Last update: 2026-06-22 12:55 UTC
4196.640
Forecast update for Gold -22-06-2026
2026-06-22 10:41 UTC
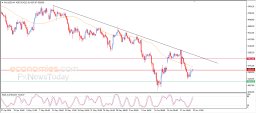
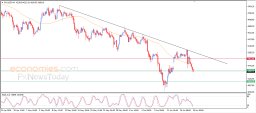
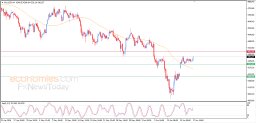
Gold extended its gains in its latest intraday trading, supported by the positive signals from the relative strength indicators, with the indicators reaching exaggerated overbought ...
Gold Attempts to Recover Some of Its Losses – Analysis – 22-06-2026
2026-06-22 01:05 UTC
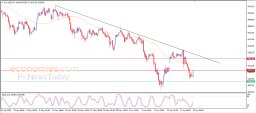
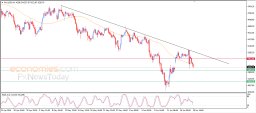
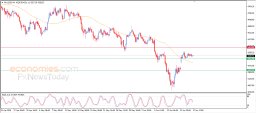
Gold surged high in its recent intraday trading, supported by an improvement in technical momentum after relative strength indicators reached deeply oversold levels. These indicators have ...
Evening update for gold-19-06-2026
2026-06-19 16:50 UTC
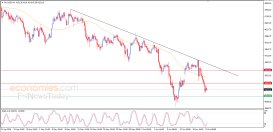
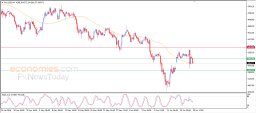
Gold settles lower during its latest intraday trading, with the continuation of the negative and dynamic pressure that is represented by its trading below EMA50, reducing the chances ...
Forecast update for Gold -19-06-2026
2026-06-19 11:28 UTC
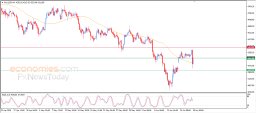
Gold declined in its latest intraday trading, amid continued negative pressure resulting from trading below EMA50, limiting the chances of a full recovery in the near term. This comes ...
Gold Reaches Our Target Price – Analysis – 19-06-2026
2026-06-19 00:51 UTC
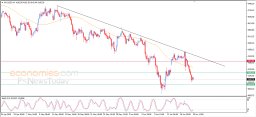
Gold extended its losses in recent intraday trading, breaking below the $4,200 support level, which was our final projected downside target. This bearish move confirms the continuation of ...
Evening update for gold-18-06-2026
2026-06-18 16:01 UTC
Gold continued to decline during its latest intraday trading, breaking below the support of its EMA50, thereby diminishing hopes for a near-term recovery. This comes amid continued ...
Forecast update for Gold -18-06-2026
2026-06-18 10:47 UTC
Gold prices slipped lower during recent intraday trading, erasing all the gains achieved earlier in the day. The metal had initially gained positive momentum after finding support at the ...
Gold Receives Some Support – Analysis – 18-06-2026
2026-06-18 01:01 UTC
Gold rose in recent intraday trading after finding support at its EMA50, which provided an important technical base and helped the price regain some positive momentum while recovering ...
Evening update for gold-17-06-2026
2026-06-17 16:39 UTC
Gold rose during its latest intraday trading, with positive signals emerging from the relative strength indicators, supported by continued trading above its EMA50, which acts as a dynamic ...
Forecast update for Gold -17-06-2026
2026-06-17 10:24 UTC
Gold prices continue to fluctuate during recent intraday trading, while negative signals emerge from the relative strength indicators after offloading its previous oversold conditions, which may ...