Copper price records the target– Forecast today – 9-2-2026
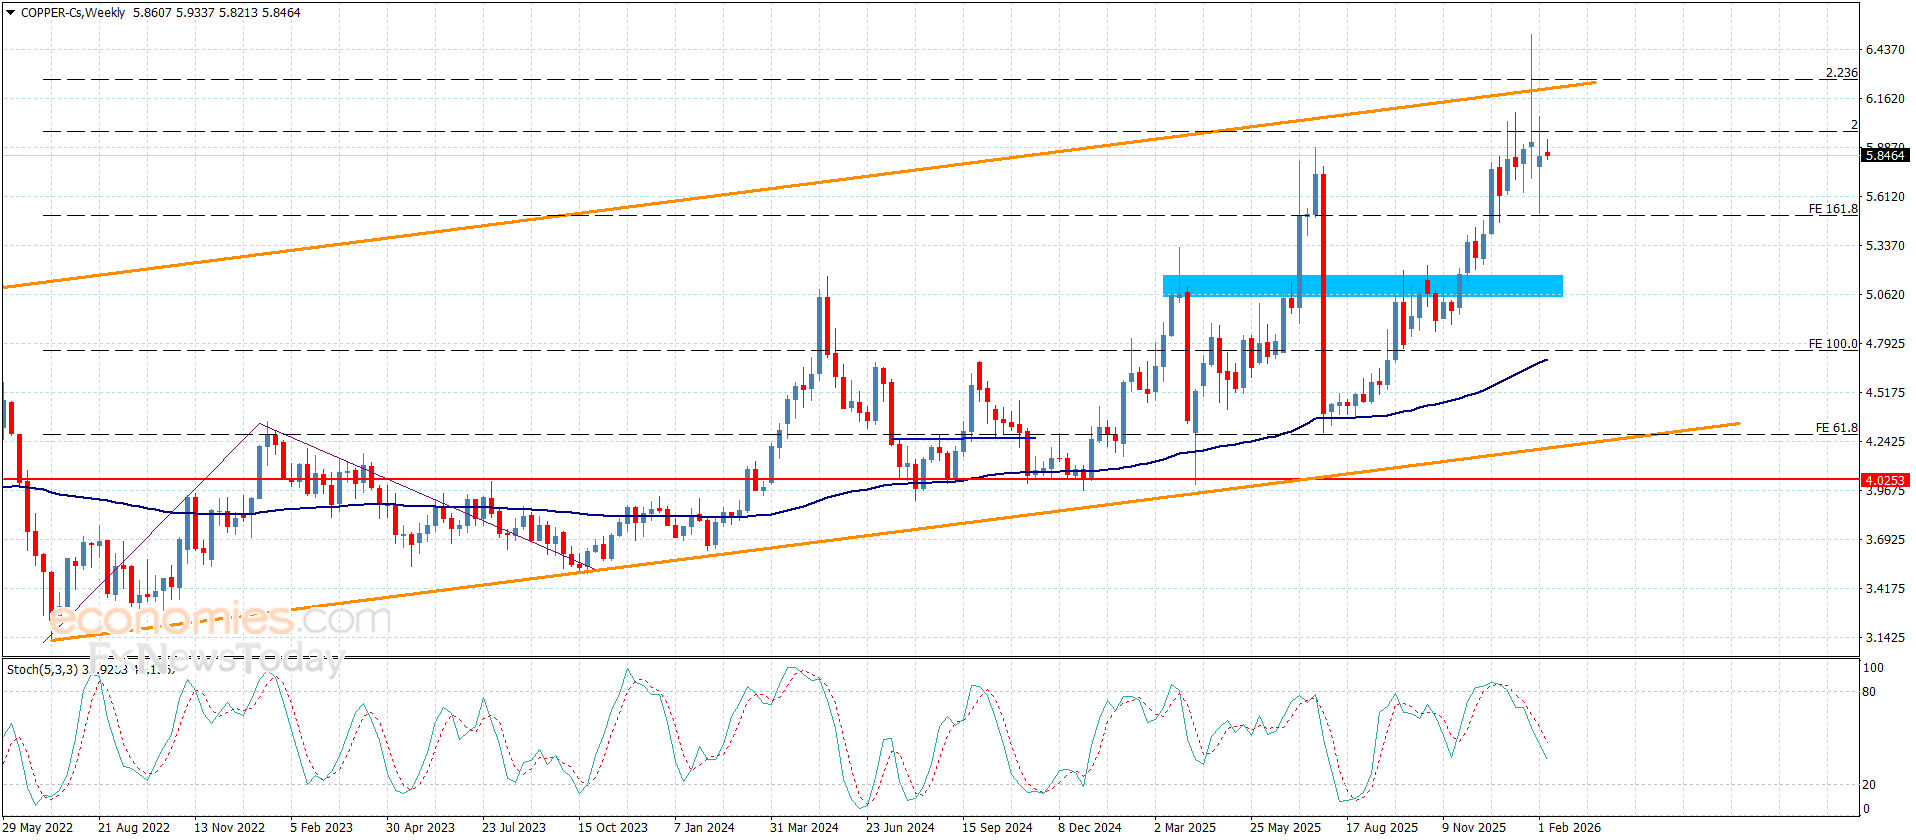
Copper price reached the corrective target in Friday’s trading by reaching $5.5100 extra support level, rebounding quickly but its stability below $5.9700 barrier by providing negative momentum by stochastic, so that makes us keep the corrective scenario in the near- term trading.
Therefore, we expect renewing the negative attempts to press on $5.5100 level again, and breaking it will ease the mission of targeting new negative stations that might extend towards $5.4100 and $5.2800.
The expected trading range for today is between $5.5100 and $5.9500
Trend forecast: Bearish
The (ETHUSD) is under negative pressure- Analysis- 09-02-2026
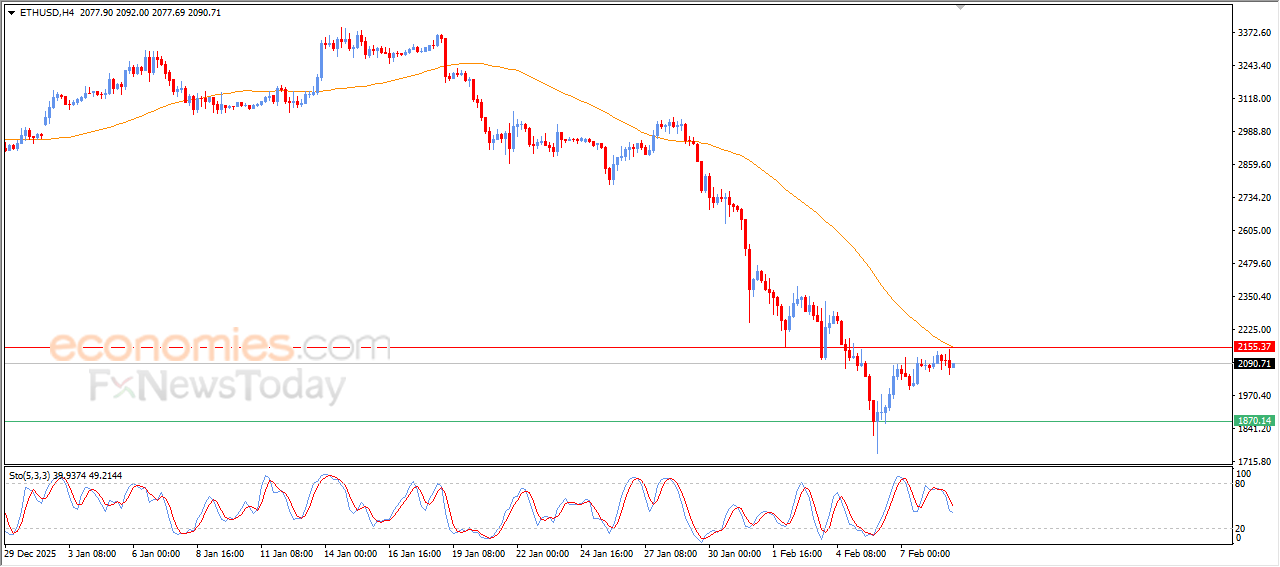
The (ETHUSD) price declined in its last intraday trading, affected by reaching EMA50’resistance, which forced it to rebound lower, to surrender to the negative pressure, amid the dominance of the main bearish trend on short-term basis, with the emergence of negative signals from relative strength indicators, after reaching overbought levels, intensifying the negative pressures on the price.
Brent crude oil price is between hammer and anvil- Analysis- 09-02-2026
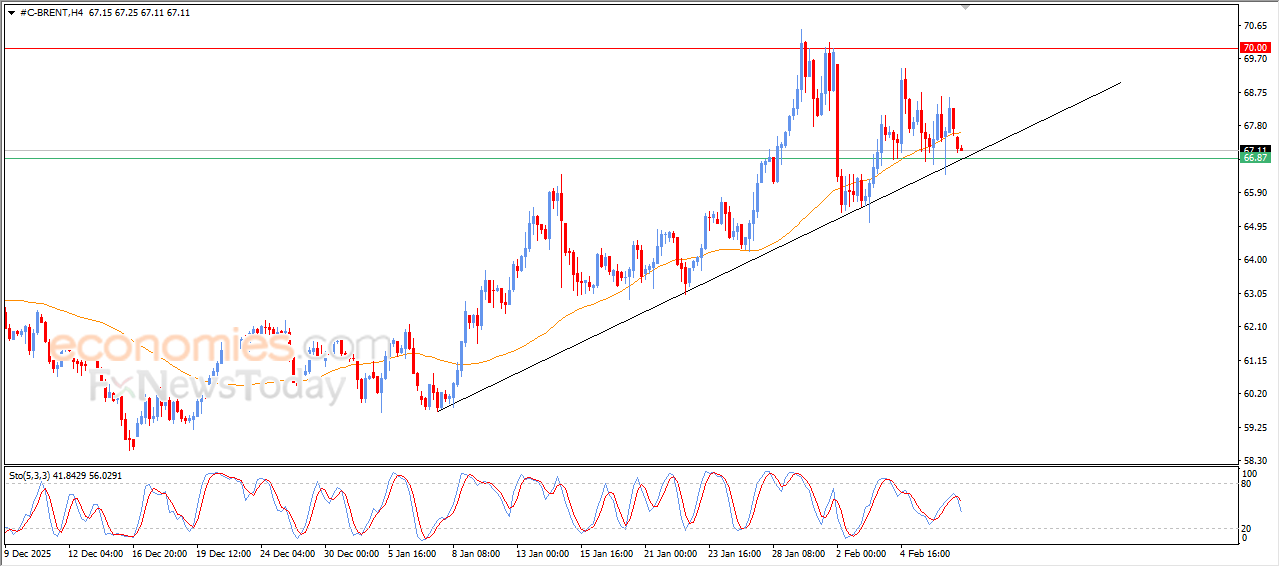
The (Brent) price declined in its last intraday trading, with the emergence of negative signals from relative strength indicators, surpassing EMA50’s support to put it under negative pressure on near-term basis, approaching from leaning on the bullish trendline’s support on short-term basis, in a last attempt to gain bullish momentum that might help it to recover and rise again.
The USDCHF Price is showing new positive signals- Analysis-09-02-2026
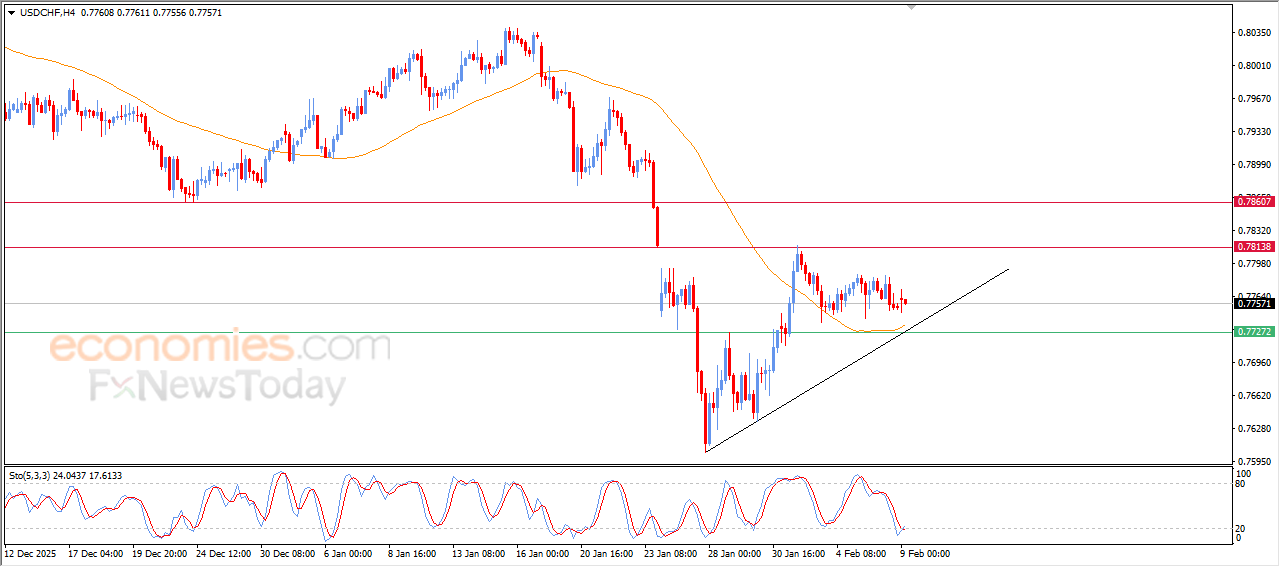
The (USDCHF) price continued its sideways trading on its last intraday levels, in attempt to gain bullish momentum that might help it to recover and rise again, with the dominance of bullish corrective wave on short-term basis, with its trading alongside supportive trend line for this path, besides the continuation of the dynamic support that is represented by its trading above EMA50, reinforcing the chances of the price recovery on near-term basis, especially with the beginning of forming positive divergence on relative strength indicators, after reaching oversold levels, exaggeratedly compared to the price move, with the emergence of positive overlapping signals from there.