Copper price provides weak trading– Forecast today – 22-5-2026
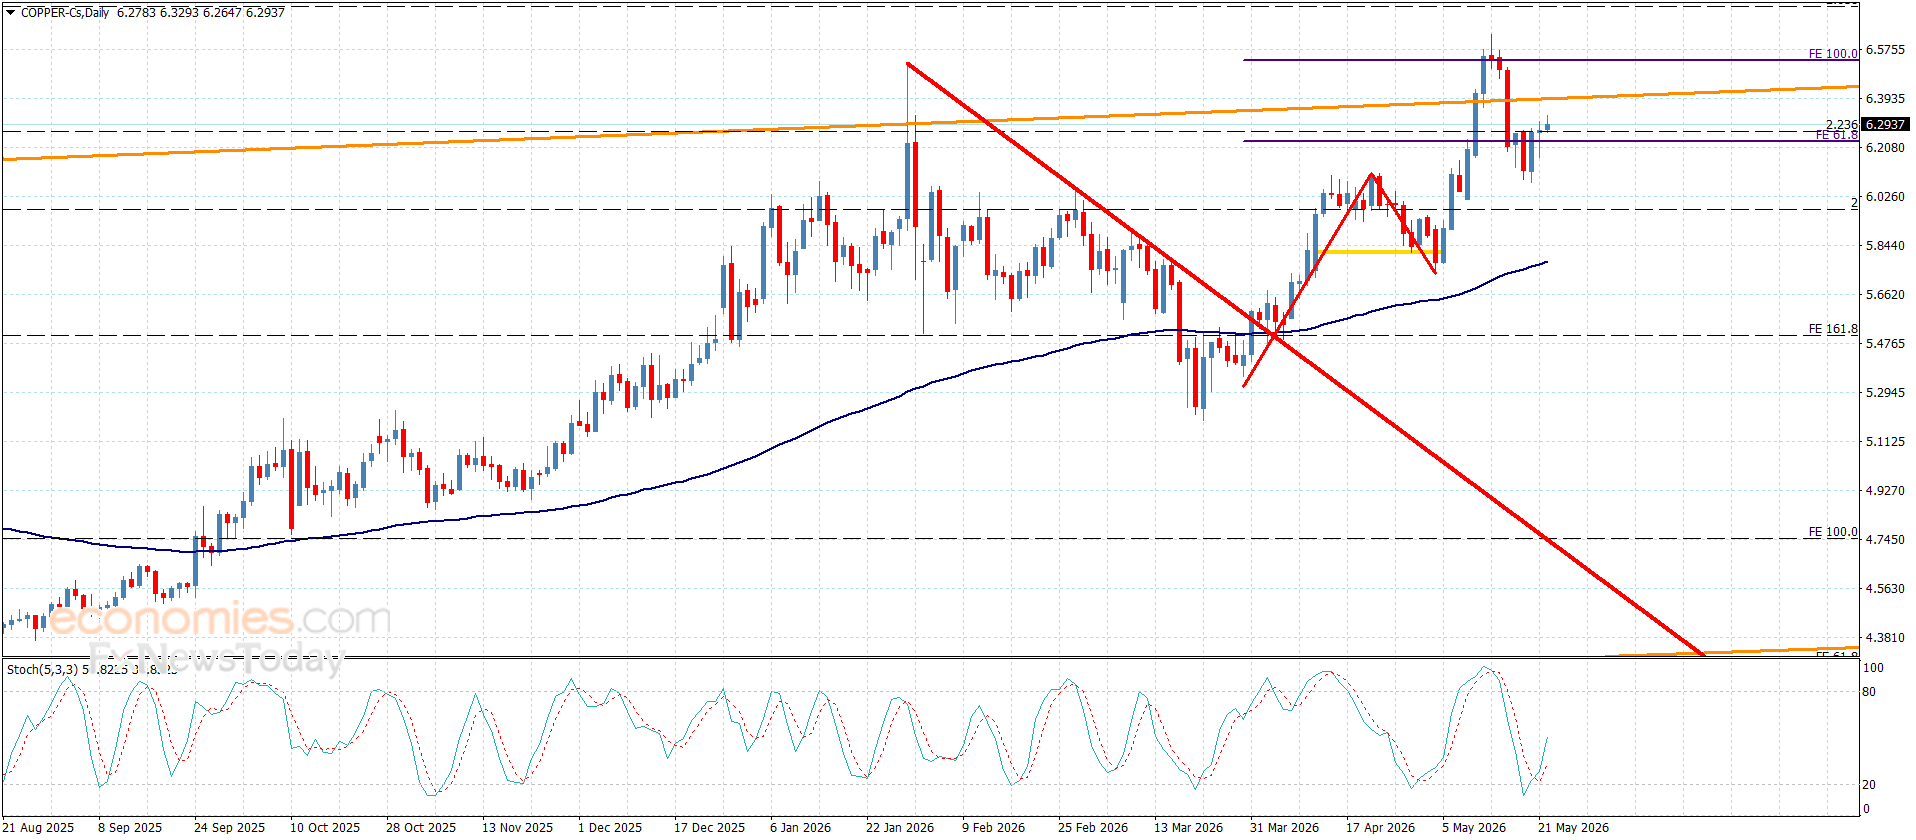
Copper price was forced to provide weak trading due to the continuation of the main indicators’ contradiction against the negative stability below the barrier at $6.3800 level, to force it to delay the corrective decline and hold near $6.2800 level.
Note that confirming the dominance of the bearish corrective trend needs to break the initial support at $6.1000, to ease the mission of the corrective stations, which might begin at $5.9500 and $58000, while surpassing the barrier will provide a chance for recording some gains, to expect attacking the resistance near $6.5800.
The expected trading range for today is between $6.1000 and$6.3500
Trend forecast: Bearish
Ethereum (ETHUSD) Searches for Direction – Analysis – 22-05-2026
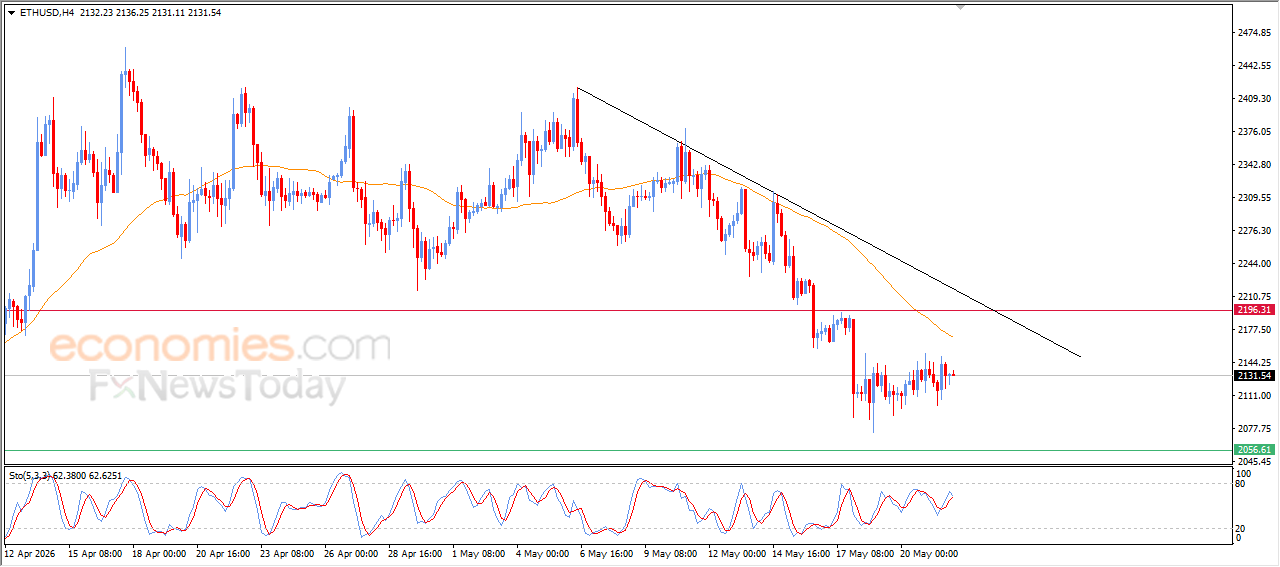
(ETHUSD) continued to trade in a choppy and sideways manner during its latest intraday movements, amid the dominance of a short-term bearish trend. Price action remains aligned with a downward-sloping trendline, while persistent negative and dynamic pressure continues due to trading below EMA50, which limits the chances of a sustainable recovery in the near term.
On the other hand, positive signals are emerging from the relative strength indicators, which has helped curb deeper declines over the recent period and suggests some underlying attempt to stabilize.
Brent Crude Oil Surrounded by Negative Pressure – Analysis – 22-05-2026
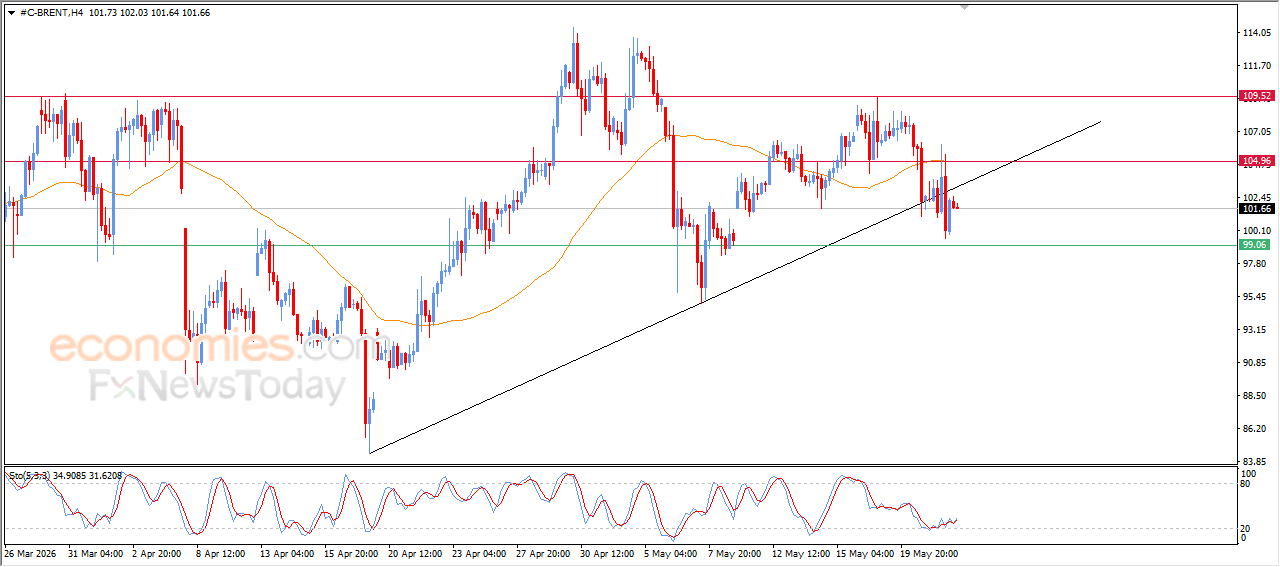
Brent crude oil declined in its recent intraday trading after previously facing resistance at EMA50, which forced the price lower and ended earlier upside attempts. This movement also confirmed a break below a short-term ascending trendline, reinforcing the bearish technical structure in the near term.
On the other hand, positive signals are emerging from the relative strength indicators after reaching deeply oversold conditions, which helped the price stabilize and attempt to absorb some of the selling pressure.
USDCHF Shows New Positive Signals – Analysis – 22-05-2026
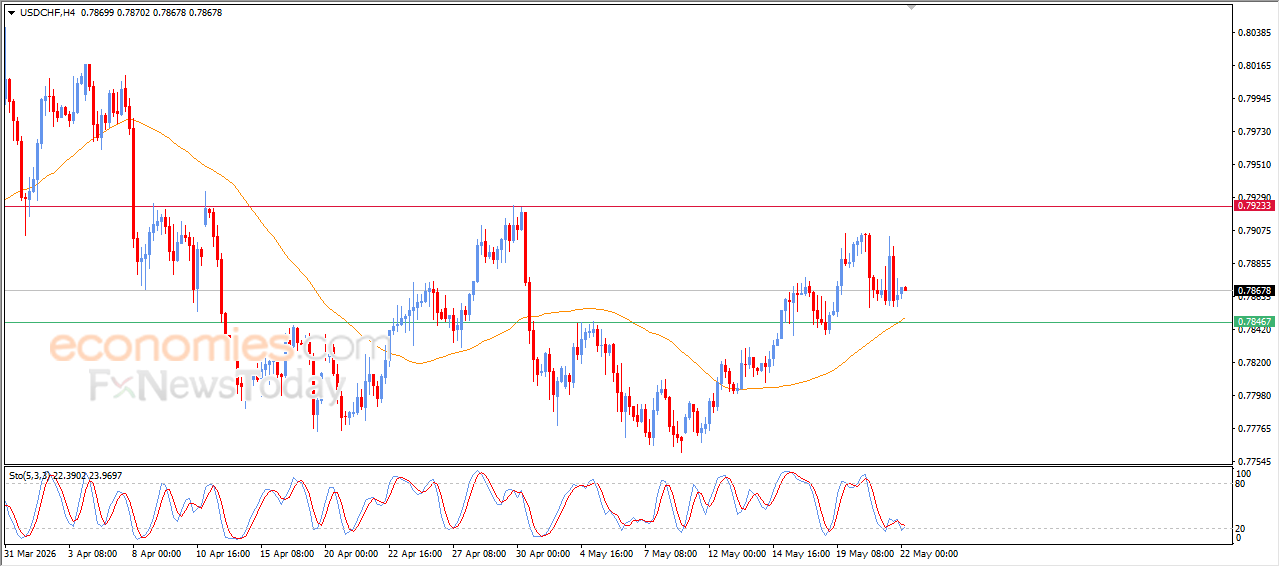
The (USDCHF) posted limited gains during its latest intraday trading amid the dominance of a short-term corrective bullish wave. This comes with continued positive and dynamic pressure as the pair trades above EMA50, which strengthens the chances of recovery in the near term.
Additionally, early positive crossover signals are beginning to appear on the relative strength indicators after reaching deeply oversold conditions relative to price action, suggesting the potential formation of a bullish divergence that could support further upside movement.