Copper price is waiting to confirm the breach– Forecast today – 2-3-2026
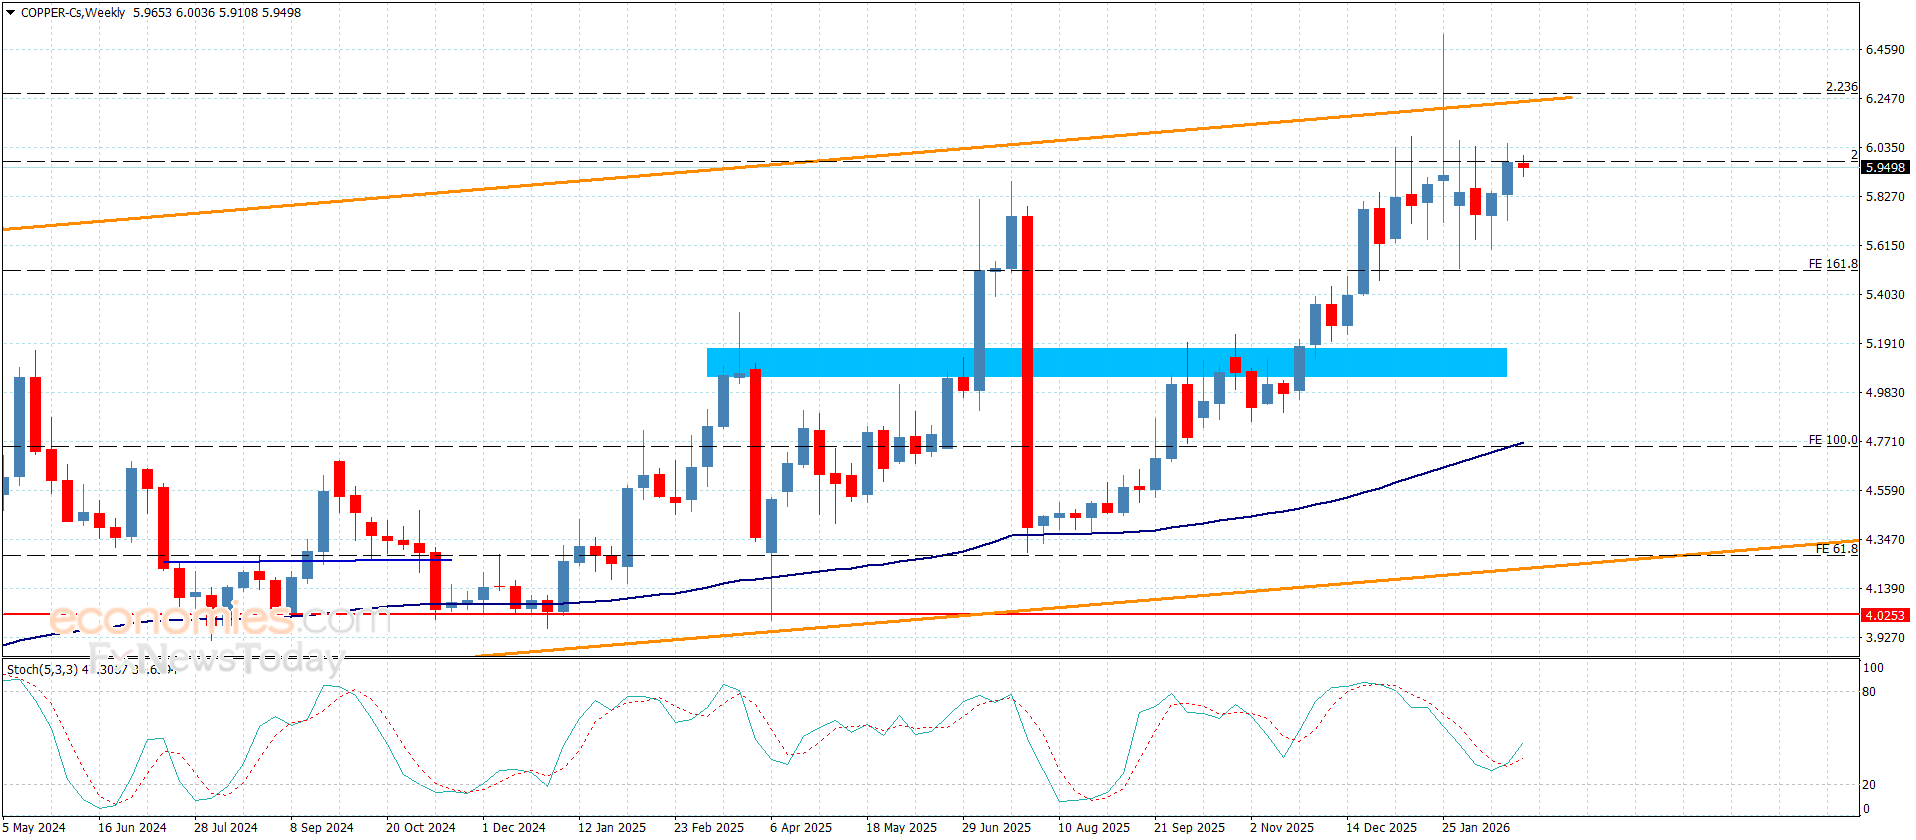
Copper prices failed to provide positive close above $5.9700 level, which forces it to delay the bullish rally and provide sideways trading, fluctuating near $5.9400 level.
The sideways trading might continue in the near period, until it is activated the main indicators’ positivity, to reinforce the chances of resuming the rise and reaching positive stations that is located at $6.1200 and $6.2400 level, while reaching below $5.8100 will force it to suffer some losses before reaching the suggested positive stations.
The expected trading range for today is between $5.8500 and $6.1200
Trend forecast: Bullish
The (ETHUSD) is rising amid the negative pressures- Analysis- 02-03-2026
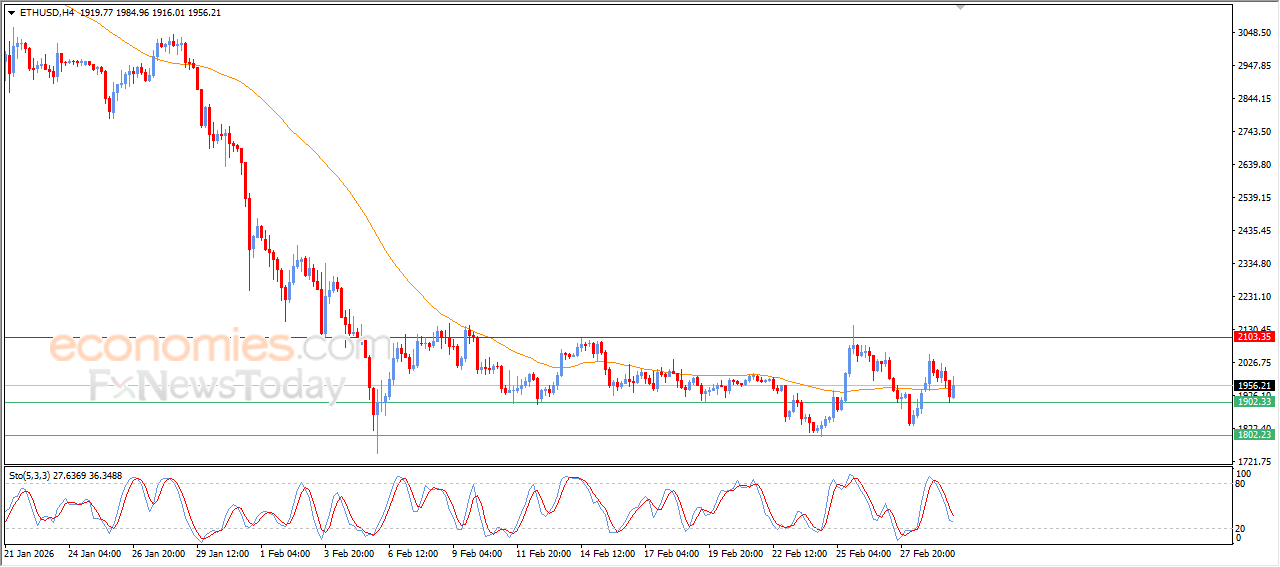
The (ETHUSD) price rose on its last intraday levels, with the continuation of the negative and dynamic pressure that is represented by its trading below EMA50, under the dominance of the main bearish trend on short-term basis, intensifying the negative pressures on the price, besides the emergence of negative signals on relative strength indicators, reducing the chances for full recovery on near-term basis.
Brent crude oil price surges high- Analysis- 02-03-2026
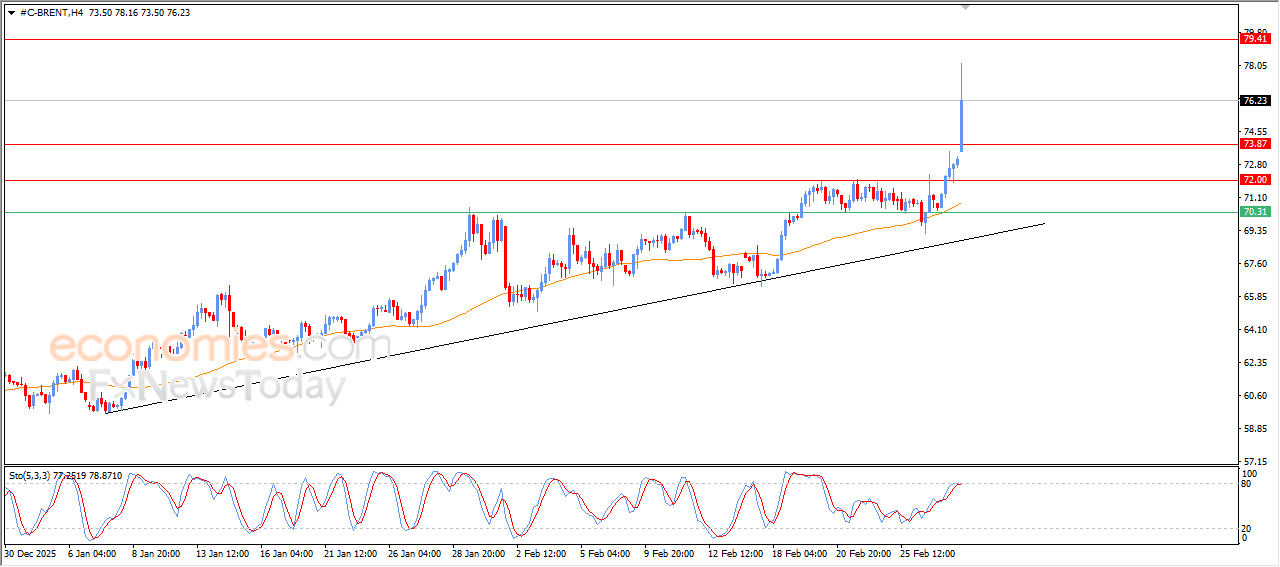
The (Brent) price surged higher in its last intraday trading, breaching $74.00 resistance, taking advantage of the positive signals from relative strength indicators, despite reaching overbought levels, supported by its continued trading above EMA50, reinforcing the dominance and stability of the main bullish trend on short-term basis, especially with its trading alongside supportive trend line for this path.
The USDCHF Price is attempting to recover some of its losses- Analysis-02-03-2026
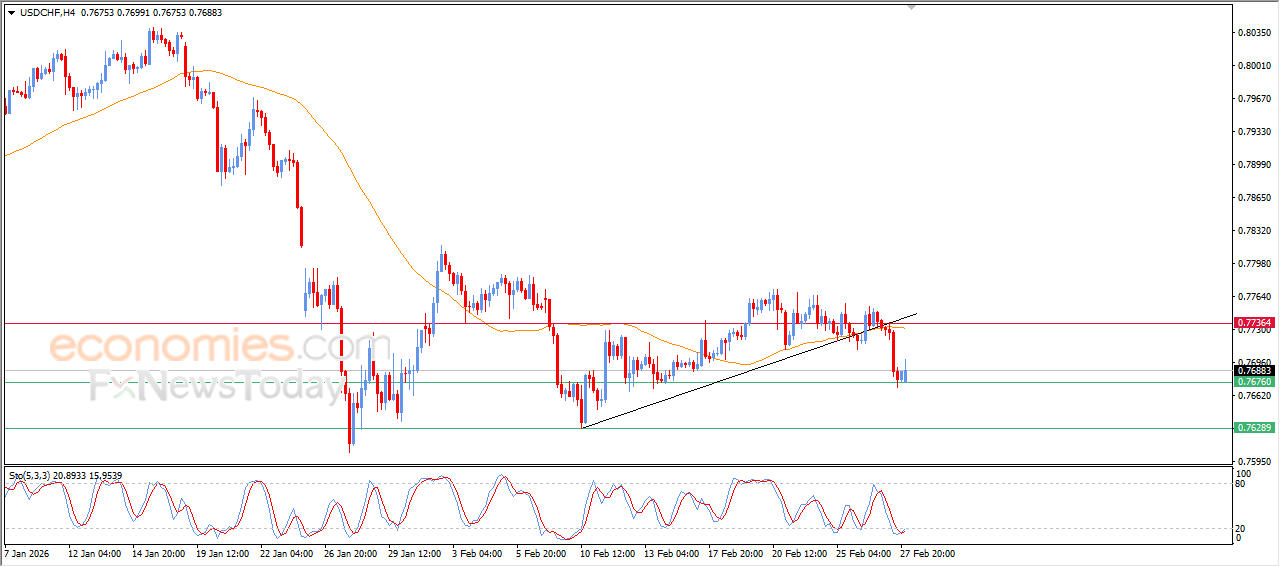
The (USDCHF) price rose on its last intraday levels, due to the stability of the current support at 0.7675, gaining some bullish momentum to attempt to recover some of its previous losses, attempting to offload some of its clear oversold conditions on relative strength indicators, with the emergence of positive overlapping signals, affected by breaking bullish corrective trend line on short-term basis, and there is negative and dynamic pressure that is represented by its trading below EMA50, intensifying the negative pressure on the price.