Copper price continues the rise– Forecast today – 3-6-2026
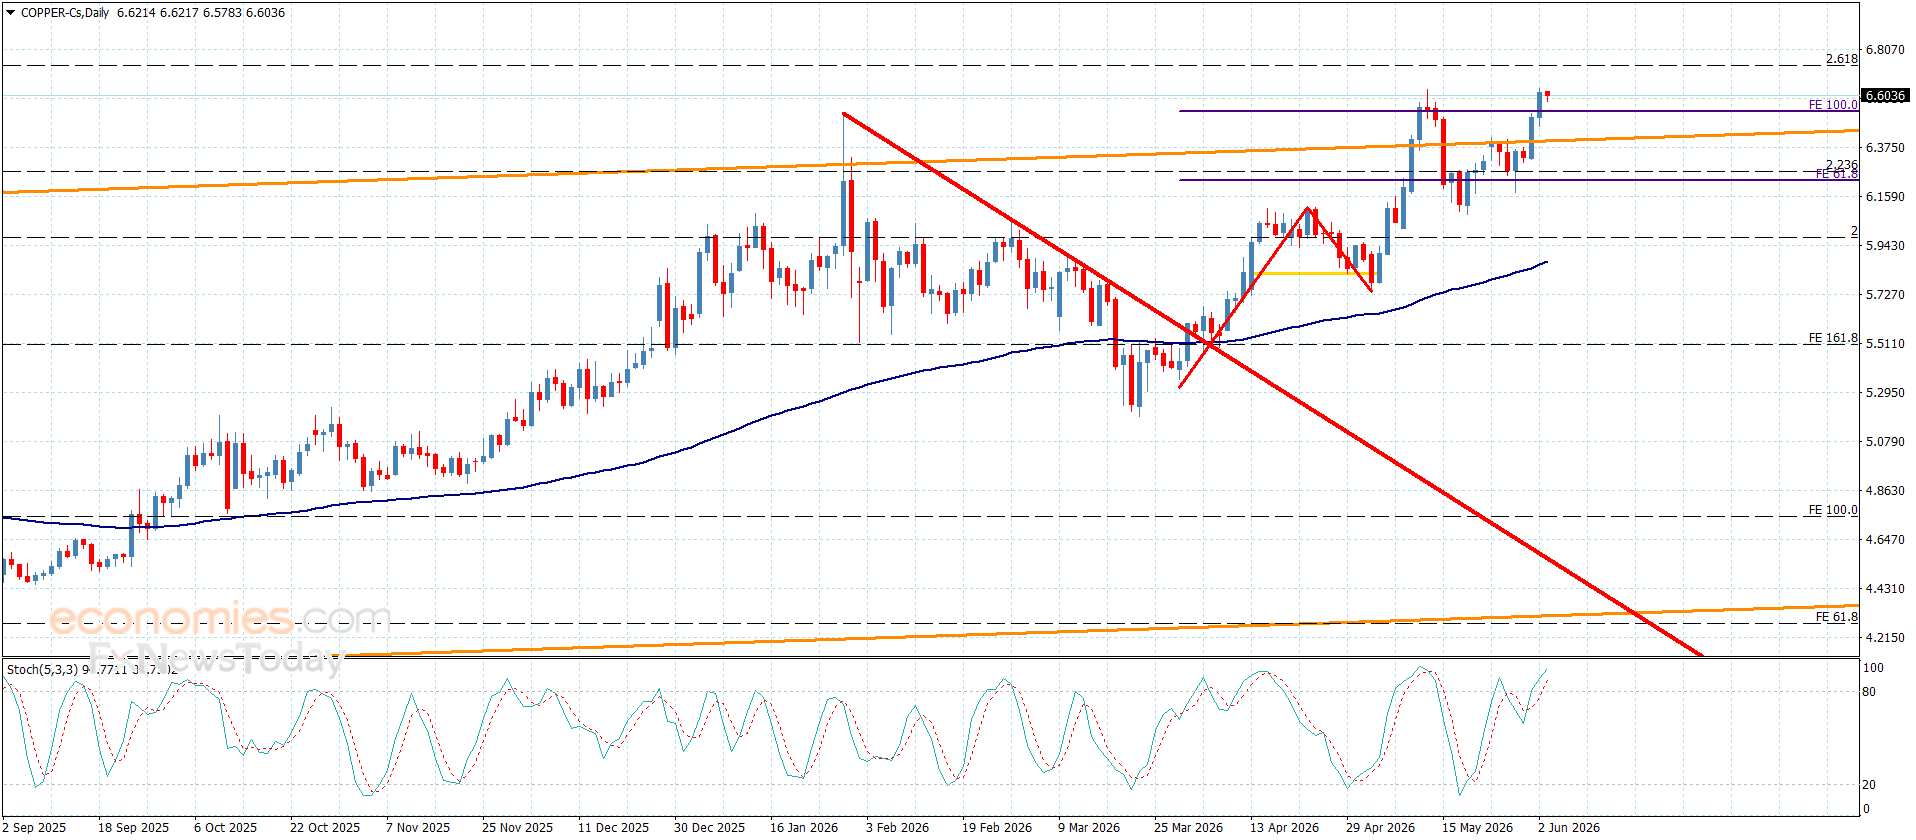
Copper price continued forming bullish waves, achieving clear gains by reaching $6.6300 level, facing the recently achieved historical top to settle near it.
Note that the positive factors that are represented by forming extra support at $6.2500 level, and providing positive momentum by the main indicators, which makes us keep the bullish scenario, to expect targeting new historical stations that might begin at $6.7400 reaching $6.9400.
The expected trading range for today is between $6.4700 and $6.7400
Trend forecast: Bullish
Ethereum (ETHUSD) breaks our expected target – Analysis – 03-06-2026
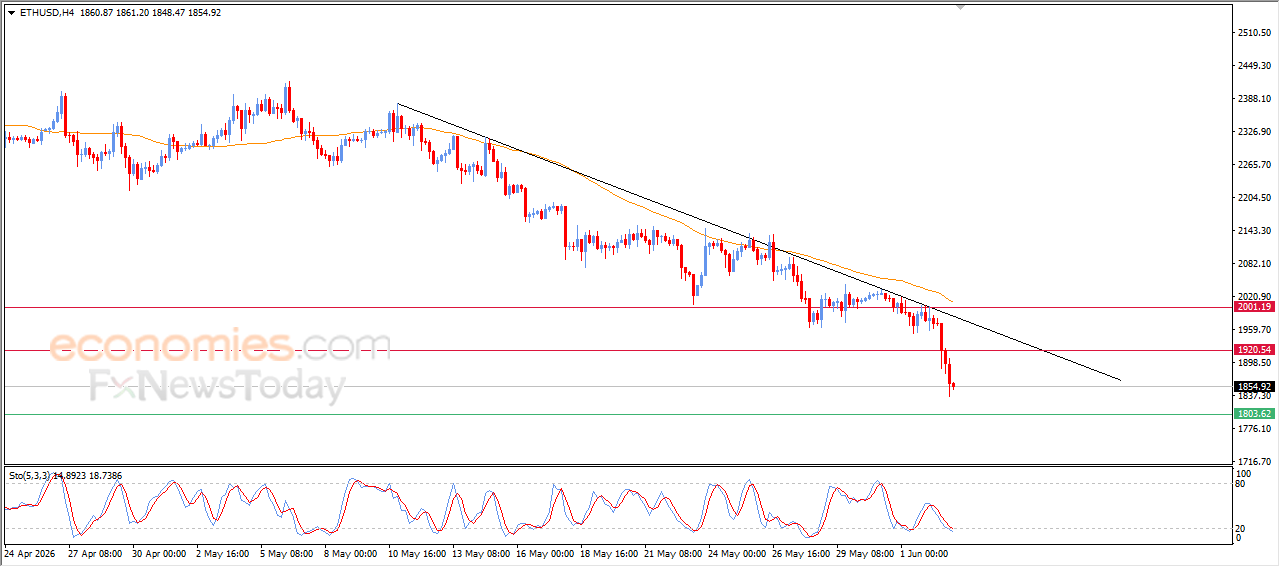
Ethereum (ETHUSD) declined in recent intraday trading after breaking $1.920 support level, which was expected target in our previous analysis, amid the dominance of the main bearish trend on the short-term basis, with its trading alongside supportive trend line for this path, with the continuation of the negative pressure that comes from its trading below EMA50, which reduces the chances of full recovery on the near-term basis, especially with the emergence of negative signals from the relative strength from the relative strength indicators, despite reaching oversold levels.
Brent Crude Oil Gets Rid of its Negative Pressures – Analysis – 03-06-2026
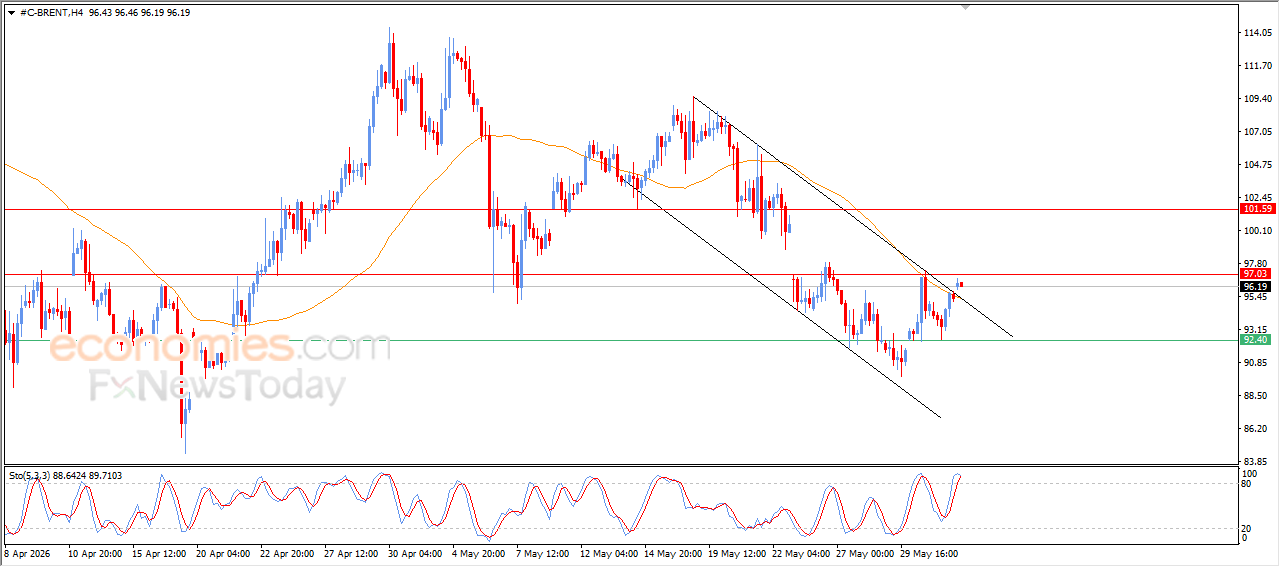
Brent crude oil settles on a series of consecutive gains in its recent intraday trading, supported by positive signals from the relative strength indicators. The price managed to breach EMA50, thereby overcoming previous negative pressure. This has generated additional bullish momentum, helping it break above the upper boundary of a short-term corrective downward price channel that had been limiting its movement earlier, which strengthens the chances of extending gains in the near term.
USDCHF Succeeds in Recovering All Early Losses – Analysis – 03-06-2026
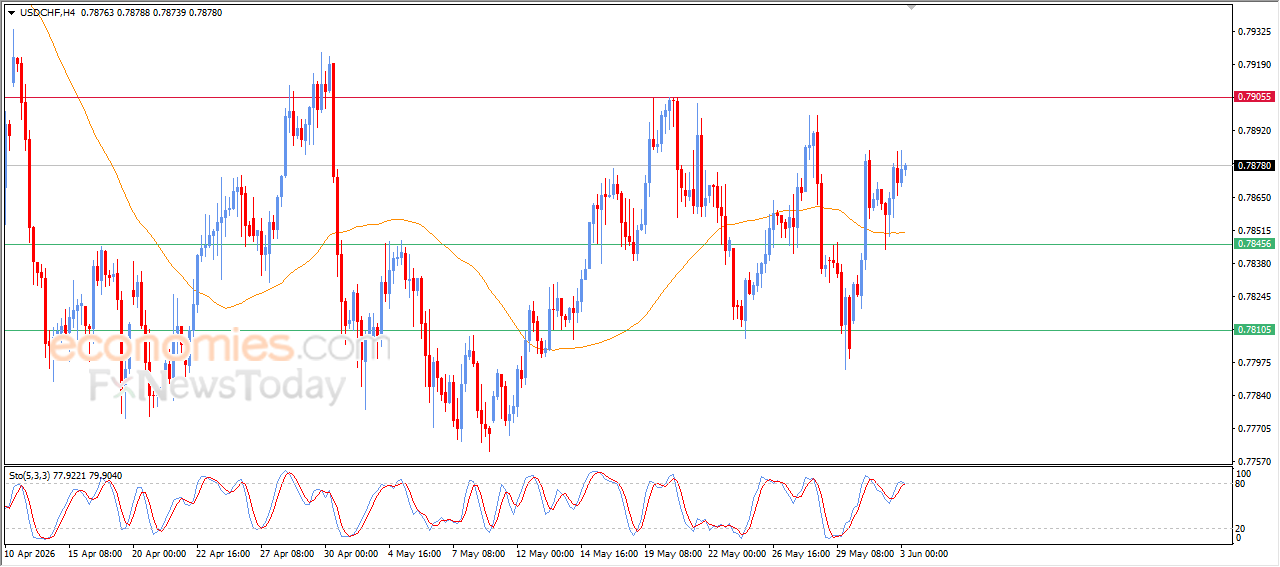
The (USDCHF) rose in its latest intraday trading after recovering from earlier losses. This helped the pair gain positive momentum supporting the short-term upward trend, with a strong bullish wave continuing to dominate. Additional positive pressure comes from the price trading above EMA50, which provides a dynamic support base that strengthens the chances of extending gains in the near term, especially with positive signals emerging from the relative strength indicators.