Brent Crude Oil Surrounded by Positive Pressure – Analysis – 20-05-2026
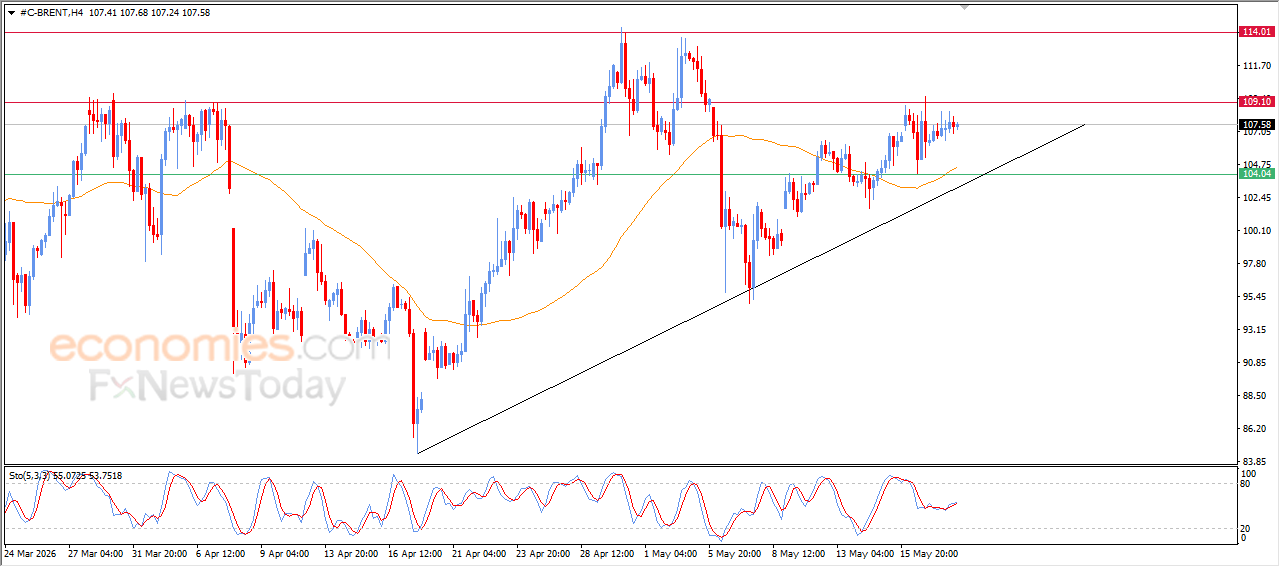
Brent crude oil kept fluctuating at recent intraday levels, while preparing to challenge the strong resistance at $109.00. The price remains supported by trading above its EMA50, which reinforces the stability of the short-term bullish trend, along with movement along an upward trendline that supports this positive structure.
In addition, relative strength indicators are showing positive signals after previously easing overbought conditions, giving the price more room to target higher resistance levels in the near term.
USDCHF Breaks Our Price Target – Analysis – 20-05-2026
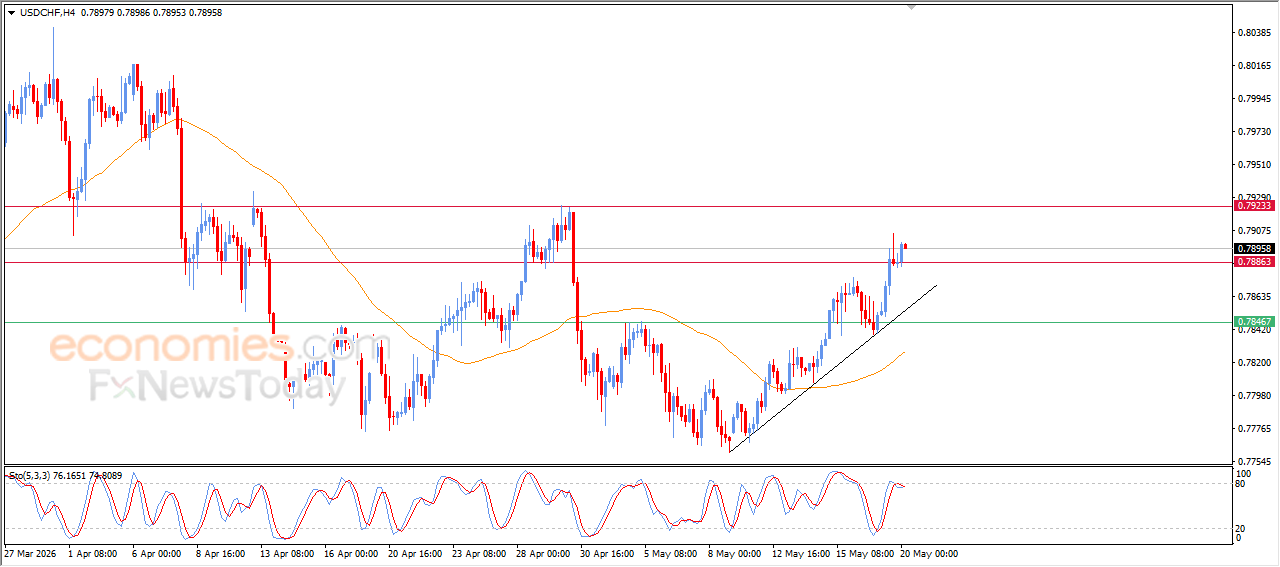
USDCHF rose during recent intraday trading, breaking above the resistance level at 0.7885, which represented a price target in our earlier analysis. The pair is now moving within a short-term corrective bullish trend, supported by a rising trendline, while remaining above its EMA50, which continues to provide positive dynamic support.
However, relative strength indicators are beginning to show negative signals after reaching overbought levels, which may limit the speed of further gains in the near term.
NZDUSD Reaches Our Price Target – Analysis – 20-05-2026
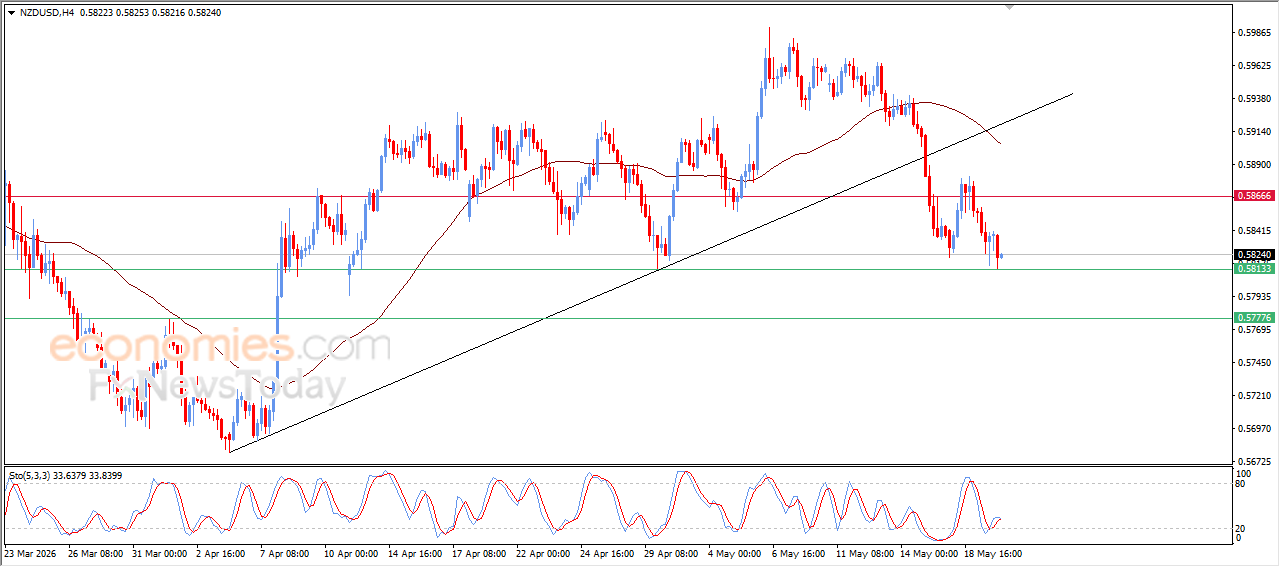
NZDUSD declined during recent intraday trading, reaching the key support level at 0.5815, which represented a price target in our earlier analysis. The pair is now stabilizing around this level as it attempts to reduce oversold conditions on the relative strength indicators, which have started to show early positive signals.
This comes amid a strong short-term corrective bearish trend, with continued negative pressure from trading below its EMA50, limiting any sustainable recovery in the near term.
AUDUSD Records Limited Gains After Reaching Our Price Target – Analysis – 20-05-2026
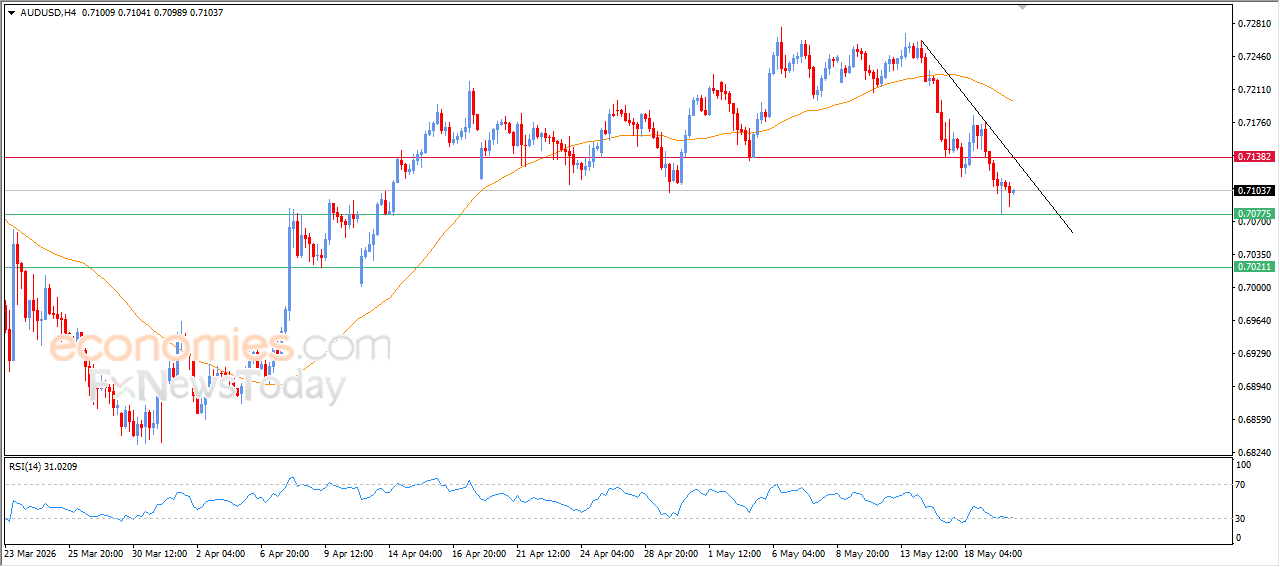
AUDUSD settled into a decline during recent intraday trading after rebounding from support at 0.7075, a level previously identified as a price target in our earlier analysis. This rebound provided some positive momentum, allowing the pair to attempt recovering part of its earlier losses, despite the continuation of a sharp short-term corrective bearish trend. The pair also remains under pressure from trading below its EMA50, which continues to act as a negative dynamic factor.
Meanwhile, relative strength indicators are still sending negative signals, despite hovering in oversold territory, which reflects persistent weakness in bullish momentum.