


 |
Sugar price tests the resistance – Analysis - 22-02-2023
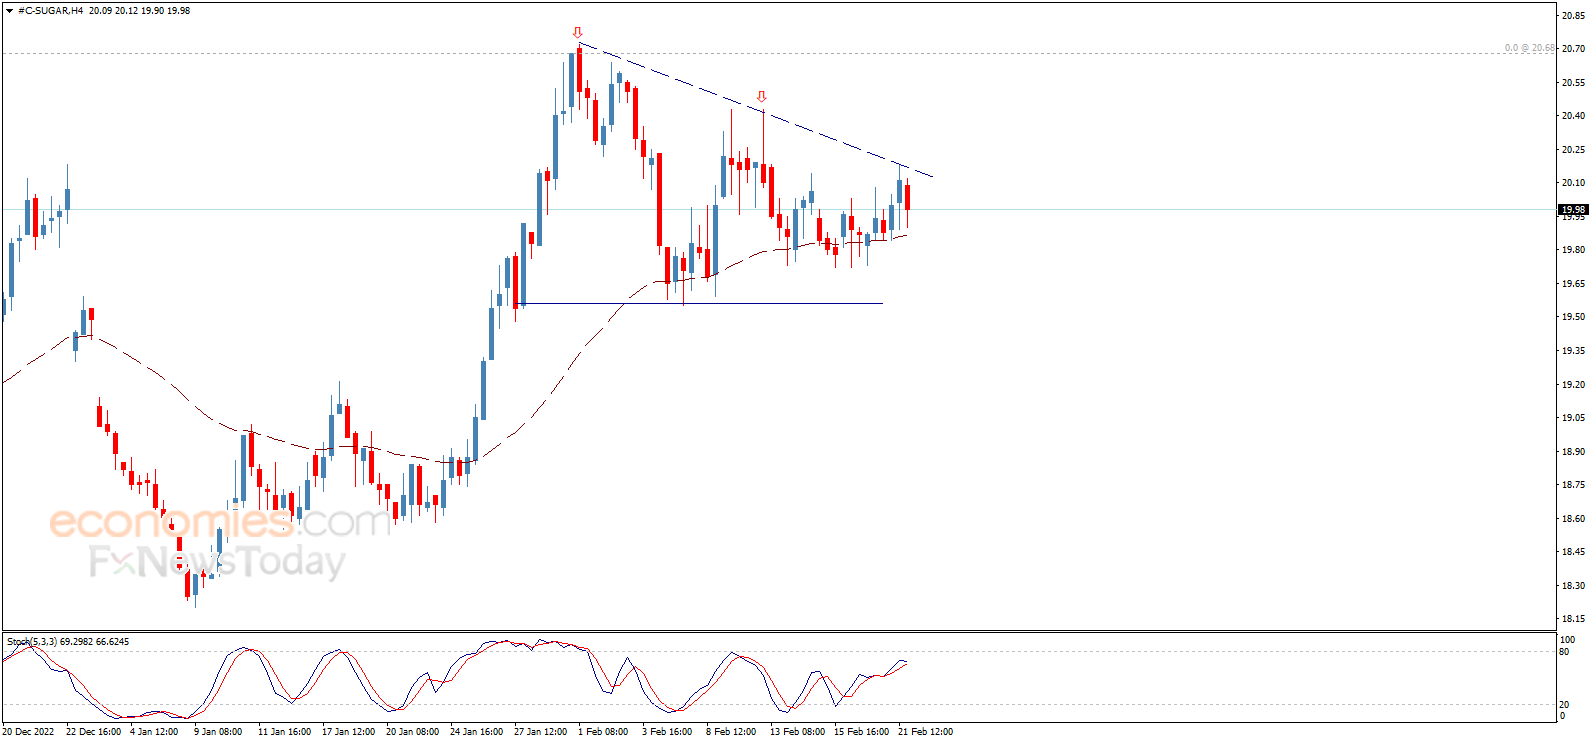
Sugar price tested the resistance line that appears on the chart and keeps its stability below it, accompanied by stochastic loss to the positive momentum clearly, waiting to motivate the price to resume the bearish trend that its targets begin by testing 19.55 level, noting that this level represents neckline for the double top pattern that appears on the chart, which means that breaking it will extend the bearish wave to target 18.50 areas on the near term basis.
Therefore, we will continue to suggest the bearish trend on the intraday and short term basis, noting that breaching 20.20 will cancel the suggested negative formation and lead the price to build new bullish wave.
The expected trading range for today is between 19.50 support and 20.25 resistance
The expected trend for today: Bearish
Thanks for your feedback.
Soybean price surpasses the resistance – Analysis - 22-02-2023
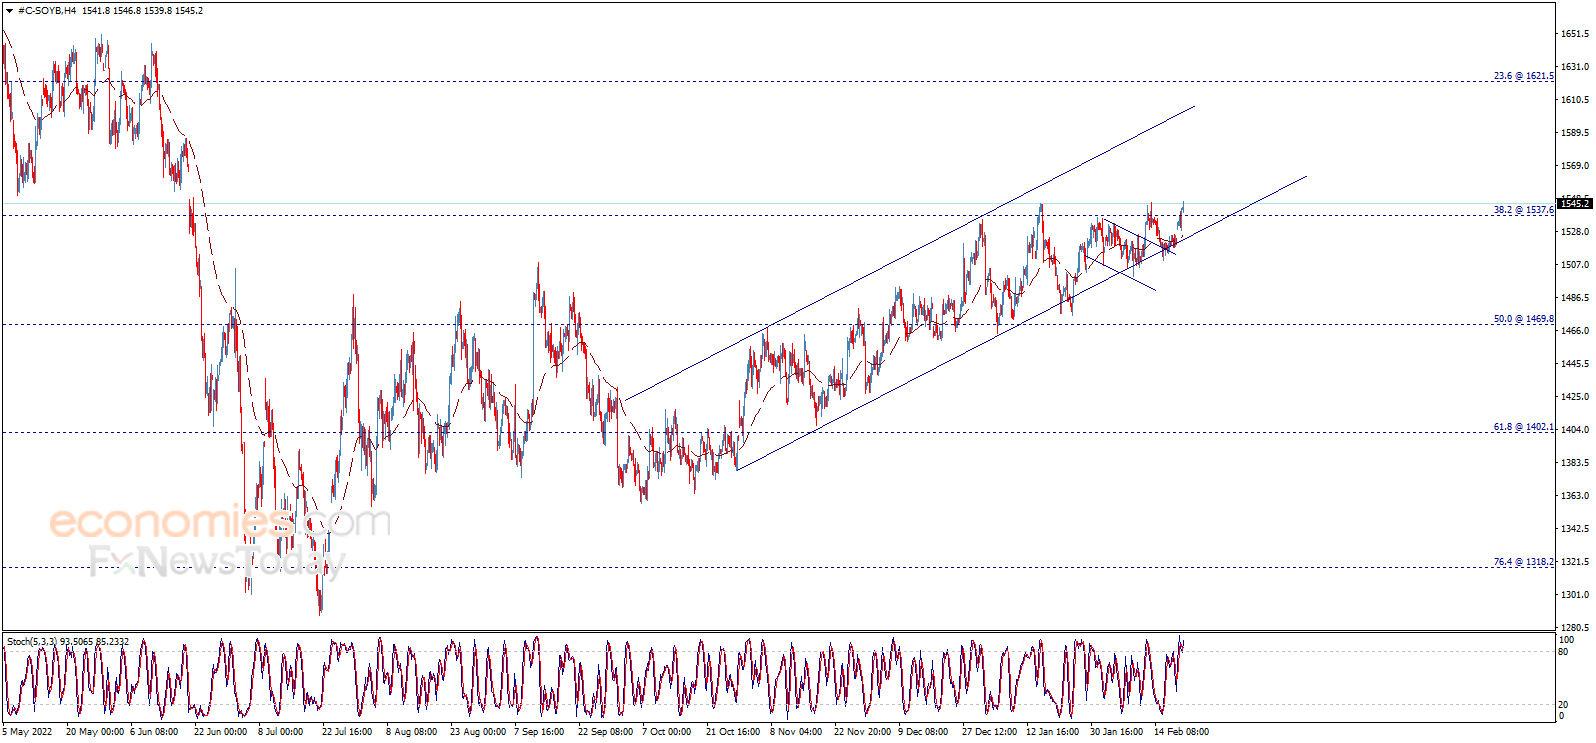
Soybean price managed to breach 1537.60 level and hold with a daily close above it, starting today with more bullish bias to move away from this level, which supports the continuation of the expected bullish trend scenario efficiently for the upcoming period, opening the way to visit 1580.00 followed by 1595.00 levels as next main targets.
MoreCorn price needs positive motive – Analysis - 22-02-2023
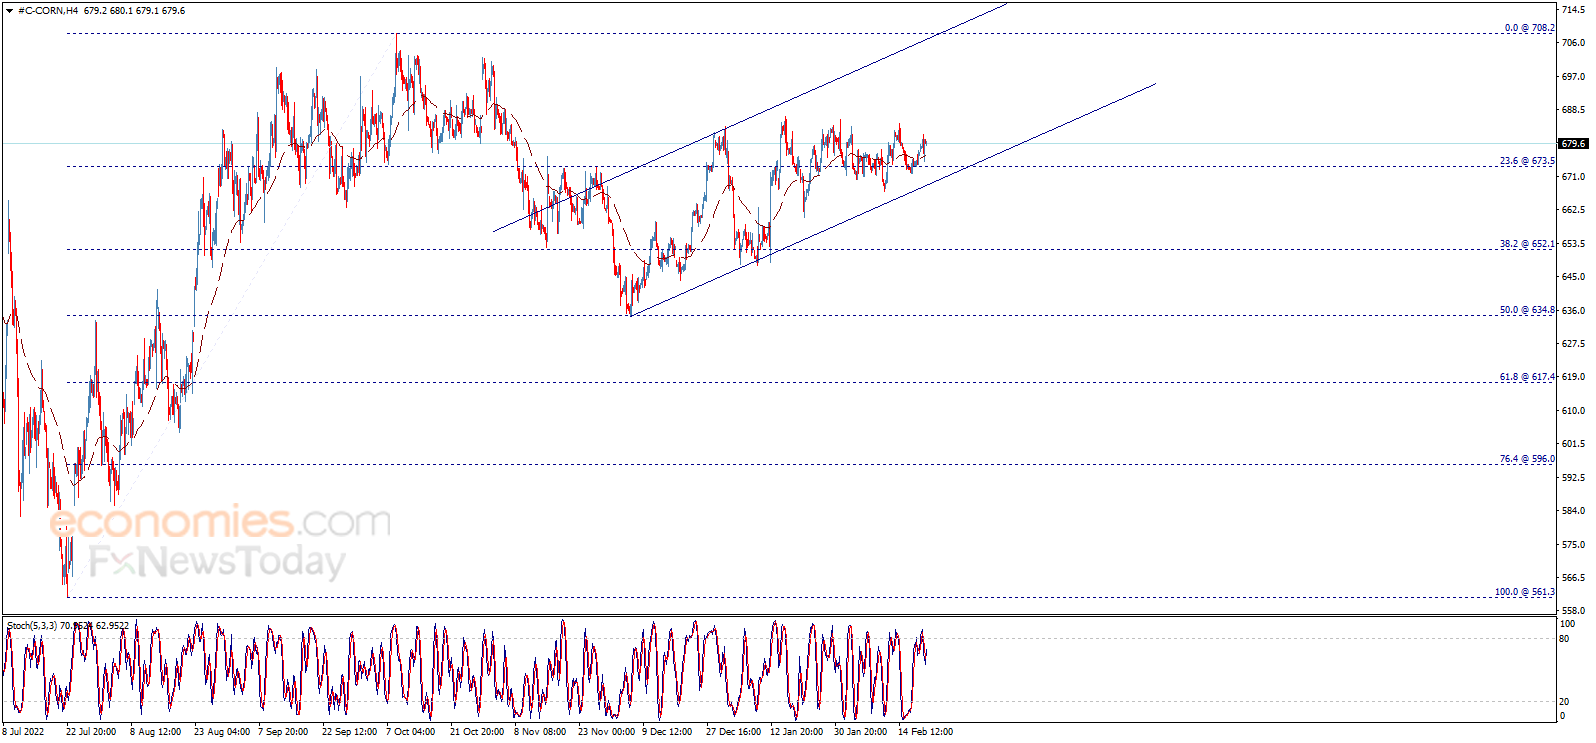
Corn price faced temporary negative pressure yesterday but it returns to rise and settle around 680.00 level, to keep the bullish trend scenario valid and active for the upcoming period, supported by the EMA50, waiting to visit 685.00 followed by 700.00 levels as next targets.
MoreThe USDCHF rises calmly – Analysis - 22-02-2023
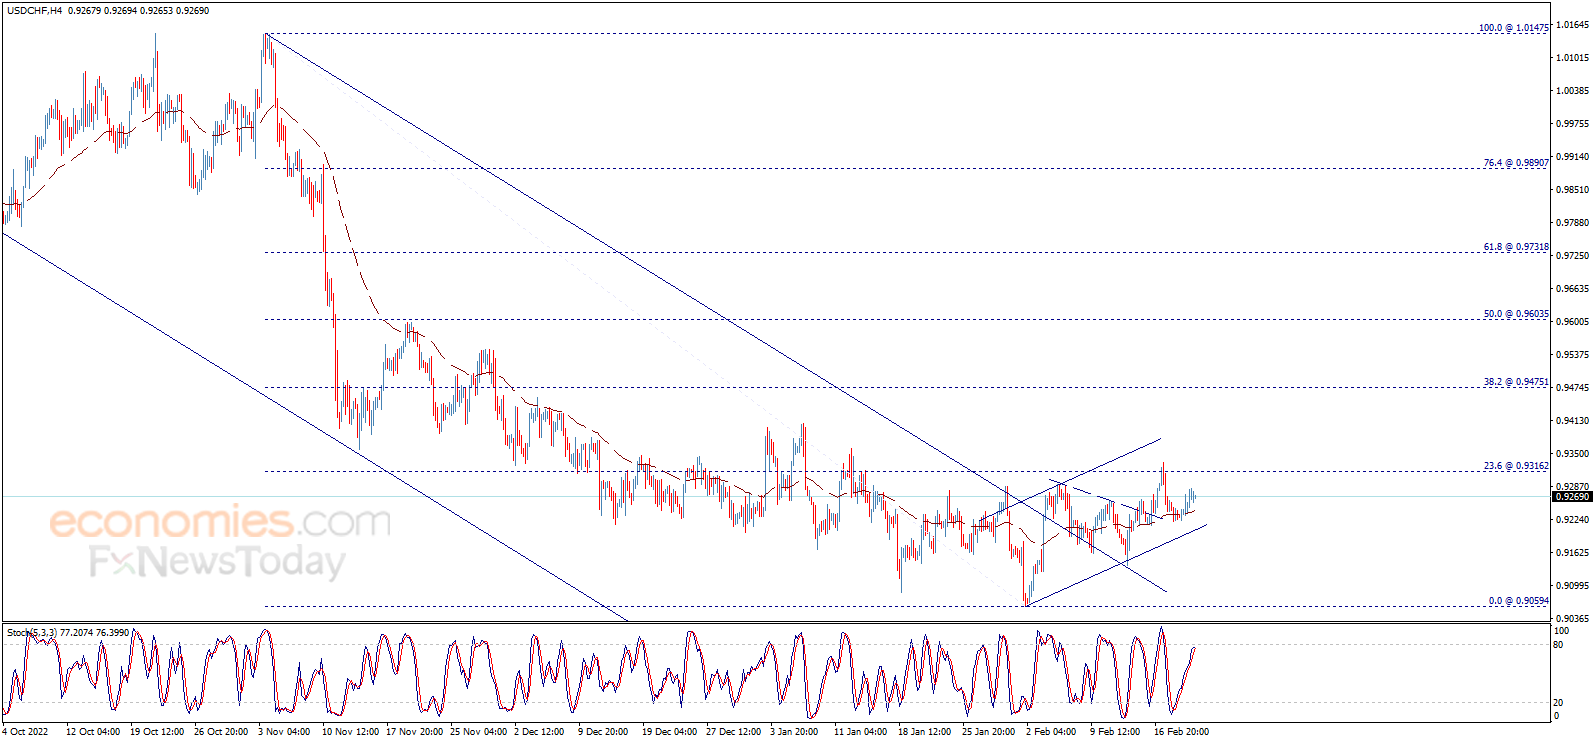
The USDCHF pair shows calm positive trades to gradually approach our first waited target at 0.9316, getting positive support by the EMA50, to reinforce the chances of continuing the rise and surpassing the mentioned level to open the way to achieve additional gains that reach 0.9400.
More