


 |
Sugar price reaches the target – Forecast today - 30-07-2024

Sugar price shows more rise to reach the thresholds of the waited target at 19.20$, which represents the broken neckline of the double top pattern that appears on the chart, which hints the importance of this level to determine the next destination, as breaching it will lead the price to achieve additional gains that reach 20.27$, while consolidating below it will push the price to decline again and visit 17.96$ initially.
Therefore, we prefer to stay aside now until the price confirms its situation according to 19.20$ level followed by detecting its next destination clearly.
The expected trading range for today is between 18.70$ support and 19.50$ resistance
Trend forecast: Neutral
Thanks for your feedback.
Soybean price attacks the support – Forecast today - 30-07-2024
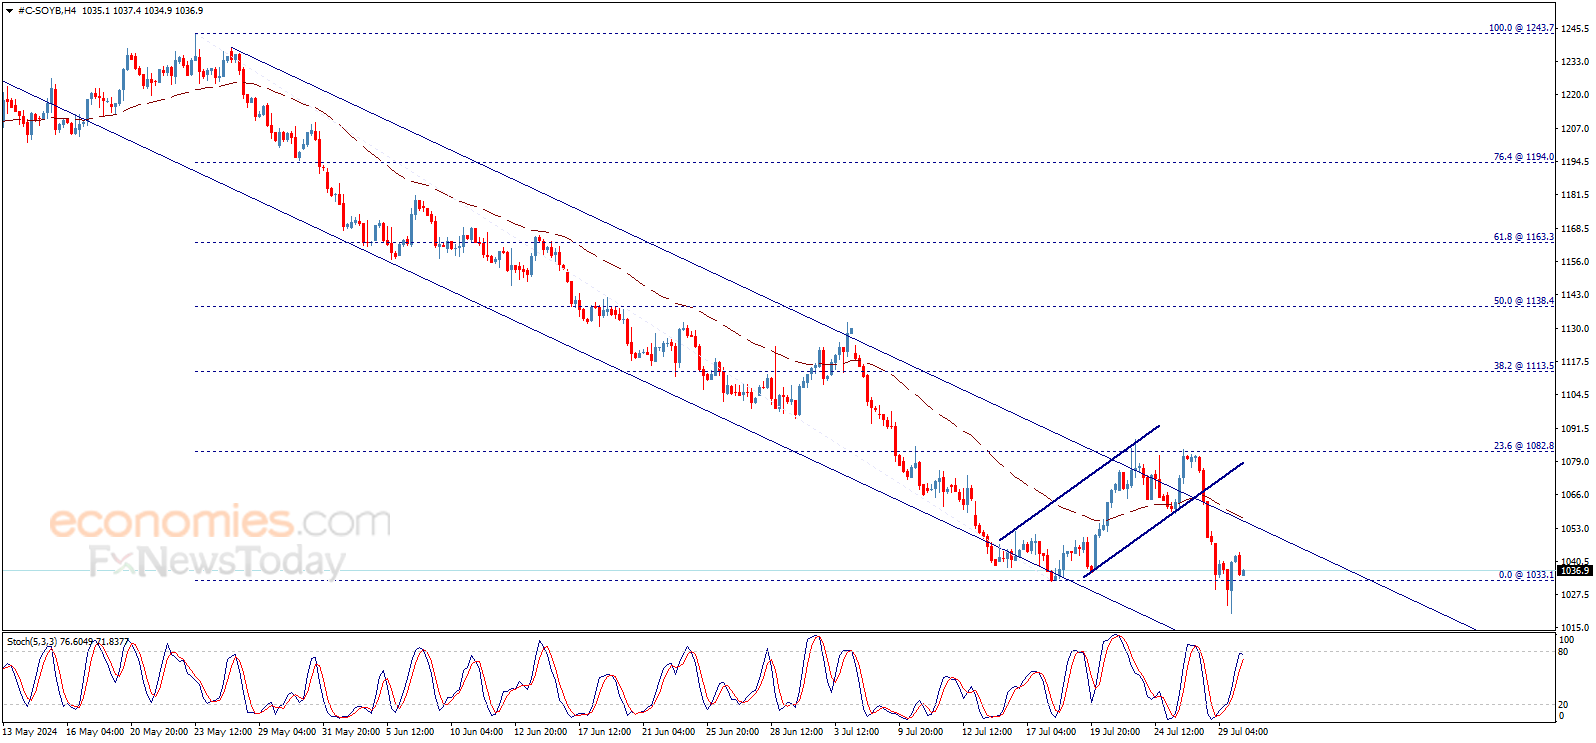
Soybean price attempted to break 1033.10$ level but it finds difficulty to hold below it until now, noticing that stochastic loses its positive momentum clearly to form negative motive that we are waiting to push the price to resume the expected bearish trend on the intraday and short-term basis, which its next targets located at 1000.00$ followed by 985.00$.
MoreCorn price gets a negative signal – Forecast today - 30-07-2024
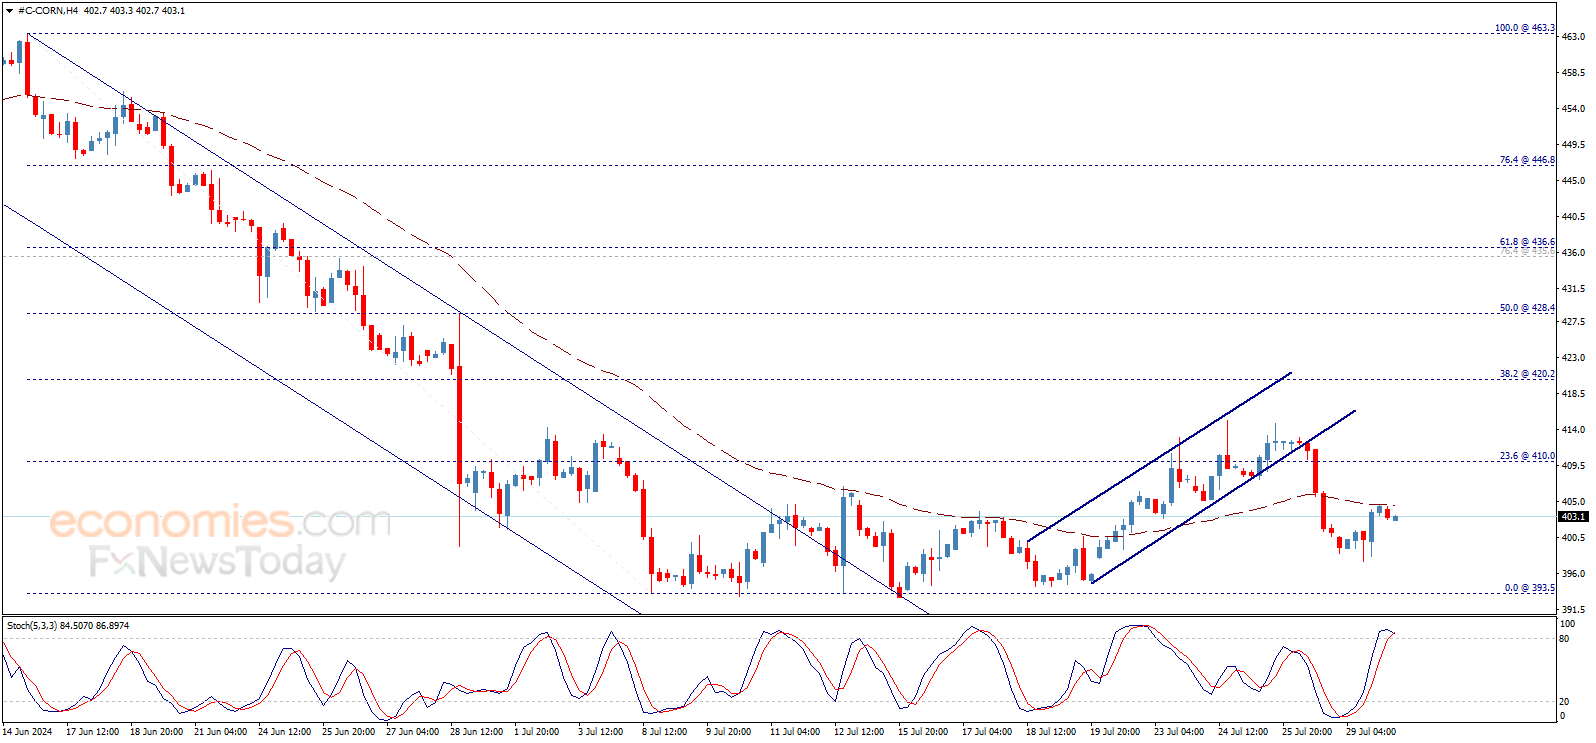
Corn price provided slight positive trades yesterday to test the EMA50 that forms good resistance against the price, noticing that stochastic begins to overlap negatively now, waiting to motivate the price to resume the expected bearish trend for the upcoming period, which its targets begin at 393.50$ and extend to 380.00$.
MoreThe USDCHF price retests the neckline – Forecast today - 30-07-2024

The USDCHF price provided additional positive trades to retest the broken neckline of the head and shoulders’ pattern that appears on the chart, and the EMA50 meets this level to add more strength to it, while stochastic shows clear overbought signals now.
More